Hitech Pipes Long
📊 Hi-Tech Pipes Ltd (NSE: HITECH) – Weekly Technical Analysis
The stock has witnessed a prolonged downtrend from its highs and recently formed a strong bullish reversal candle, signaling a potential short-term trend reversal. Key indicators are also turning positive, supporting the possibility of a
Next report date
—
Report period
—
EPS estimate
—
Revenue estimate
—
3.98 INR
729.49 M INR
30.65 B INR
95.41 M
About Hi-Tech Pipes Ltd.
Sector
Industry
CEO
Ajay Kumar Bansal
Website
Headquarters
New Delhi
Founded
1985
ISIN
INE106T01025
FIGI
BBG00C78P7R6
Hi-Tech Pipes Ltd. engages in the provision of manufacture of steel tubes and pipes. Its products include black steel and galvanized tubes, metal beam highway crash barrier, cold rolled coils, and formed sections. The company was founded on January 2, 1985 and is headquartered in New Delhi, India.
Related stocks

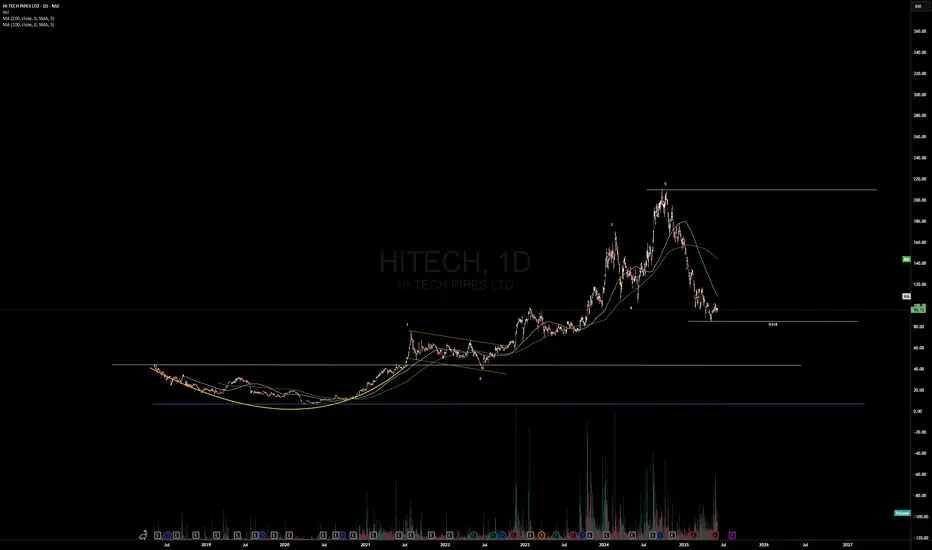
HiTech Pipes - Wave 2 seems to be over.. After a 5 wave impulse move it corrected exactly 0.618 which is the standard wave 2 correction.
And on a weekly chart it reversed with a morning star doji.
So seems like this is a sweet spot to be in - start of wave 3
Even otherwise, in case its wave A of Flat correction, we can expect Wave B whi
Hi-Tech Pipes: Double Bottom Reversal & Strong Support Zone "Hi-Tech Pipes: Double Bottom Reversal – Strong Support Zone for Upside Move"
Stock: Hi-Tech Pipes Ltd.
Analysis:
Hi-Tech Pipes has corrected from its recent highs but is now showing clear signs of reversal. The stock has formed a double bottom pattern, indicating potential upside from the current

Hi-Tech Pipes LtdHi-Tech Pipes Ltd
Positive divergence formed .
taken support at 160.
FII'S & DII'S increased their holdings....

Hi-Tech Pipes Ltd Date 06-11-2024
Hi-Tech Pipes Ltd
NSE: HITECH
Timeframe : Day Chart
Company Essentials
Market Cap ₹ 3,700.62 Cr II Enterprise Value ₹ 3,968.91 Cr.
No. of Shares 20.31 Cr II P/E 86.7
P/B 3.18 II Face Value ₹ 1
Div. Yield 0.01 % II Book Value (TTM) ₹ 57.33
CASH ₹ 25.32 Cr II DEBT ₹ 293.6

Hi Tech PipesSL 1Hr candle close only, Target Trigger Price
All detail for chat. good entry at mark price only. and must stoploss minimum risk and good profit. risk ratio 1:1 in first target. This is not call, Just my idea. Please understand your risk and take full responsibility of your actions

Hi-Tech Pipes Ltd - Breakout Setup, Move is ON...#HITECH trading above Resistance of 168
Next Resistance is at 219
Support is at 130
Here are previous charts:
Chart is self explanatory. Levels of breakout, possible up-moves (where stock may find resistances) and support (close below which, setup will be invalidated) are clearly defin

Hi-Tech Pipes Ltd - Long Setup, Move is ON...#HITECH trading above Resistance of 144
Next Resistance is at 168
Support is at 106.40
Here are previous charts:
Chart is self explanatory. Levels of breakout, possible up-moves (where stock may find resistances) and support (close below which, setup will be invalidated) are clearly define

Hitech pipes can take pull back from herePrice is in a premium zone. It will come to a discount zone now, and I have marked three points on the chat from where Price can reverse and we can make our entry according our risk punishment and in 30 minute or one hour time frame.

HITECH LONGThe Elliott Wave analysis indicates that the stock has finished waves (i) and is nearing the end of waves (ii), which are shown by blue numbers on the daily chart.
Wave (i), also known as the impulse wave, unfolded into five waves in red colour.
Wave (ii), also known as the corrective wave, unfolde

See all ideas
Summarizing what the indicators are suggesting.
Neutral
SellBuy
Strong sellStrong buy
Strong sellSellNeutralBuyStrong buy
Neutral
SellBuy
Strong sellStrong buy
Strong sellSellNeutralBuyStrong buy
Neutral
SellBuy
Strong sellStrong buy
Strong sellSellNeutralBuyStrong buy
An aggregate view of professional's ratings.
Neutral
SellBuy
Strong sellStrong buy
Strong sellSellNeutralBuyStrong buy
Neutral
SellBuy
Strong sellStrong buy
Strong sellSellNeutralBuyStrong buy
Neutral
SellBuy
Strong sellStrong buy
Strong sellSellNeutralBuyStrong buy
Displays a symbol's price movements over previous years to identify recurring trends.
Frequently Asked Questions
The current price of HITECH is 97.82 INR — it has increased by 1.00% in the past 24 hours. Watch Hi-Tech Pipes Ltd. stock price performance more closely on the chart.
Depending on the exchange, the stock ticker may vary. For instance, on NSE exchange Hi-Tech Pipes Ltd. stocks are traded under the ticker HITECH.
HITECH stock has fallen by −5.94% compared to the previous week, the month change is a −14.12% fall, over the last year Hi-Tech Pipes Ltd. has showed a −40.30% decrease.
We've gathered analysts' opinions on Hi-Tech Pipes Ltd. future price: according to them, HITECH price has a max estimate of 149.00 INR and a min estimate of 127.00 INR. Watch HITECH chart and read a more detailed Hi-Tech Pipes Ltd. stock forecast: see what analysts think of Hi-Tech Pipes Ltd. and suggest that you do with its stocks.
HITECH reached its all-time high on Sep 23, 2024 with the price of 210.85 INR, and its all-time low was 6.53 INR and was reached on Mar 26, 2020. View more price dynamics on HITECH chart.
See other stocks reaching their highest and lowest prices.
See other stocks reaching their highest and lowest prices.
HITECH stock is 2.47% volatile and has beta coefficient of 1.78. Track Hi-Tech Pipes Ltd. stock price on the chart and check out the list of the most volatile stocks — is Hi-Tech Pipes Ltd. there?
Today Hi-Tech Pipes Ltd. has the market capitalization of 19.65 B, it has increased by 2.02% over the last week.
Yes, you can track Hi-Tech Pipes Ltd. financials in yearly and quarterly reports right on TradingView.
Hi-Tech Pipes Ltd. is going to release the next earnings report on Feb 2, 2026. Keep track of upcoming events with our Earnings Calendar.
HITECH net income for the last quarter is 202.58 M INR, while the quarter before that showed 209.21 M INR of net income which accounts for −3.16% change. Track more Hi-Tech Pipes Ltd. financial stats to get the full picture.
Yes, HITECH dividends are paid annually. The last dividend per share was 0.03 INR. As of today, Dividend Yield (TTM)% is 0.03%. Tracking Hi-Tech Pipes Ltd. dividends might help you take more informed decisions.
Hi-Tech Pipes Ltd. dividend yield was 0.02% in 2024, and payout ratio reached 0.63%. The year before the numbers were 0.02% and 0.77% correspondingly. See high-dividend stocks and find more opportunities for your portfolio.
As of Dec 4, 2025, the company has 535 employees. See our rating of the largest employees — is Hi-Tech Pipes Ltd. on this list?
EBITDA measures a company's operating performance, its growth signifies an improvement in the efficiency of a company. Hi-Tech Pipes Ltd. EBITDA is 1.61 B INR, and current EBITDA margin is 5.17%. See more stats in Hi-Tech Pipes Ltd. financial statements.
Like other stocks, HITECH shares are traded on stock exchanges, e.g. Nasdaq, Nyse, Euronext, and the easiest way to buy them is through an online stock broker. To do this, you need to open an account and follow a broker's procedures, then start trading. You can trade Hi-Tech Pipes Ltd. stock right from TradingView charts — choose your broker and connect to your account.
Investing in stocks requires a comprehensive research: you should carefully study all the available data, e.g. company's financials, related news, and its technical analysis. So Hi-Tech Pipes Ltd. technincal analysis shows the sell today, and its 1 week rating is sell. Since market conditions are prone to changes, it's worth looking a bit further into the future — according to the 1 month rating Hi-Tech Pipes Ltd. stock shows the sell signal. See more of Hi-Tech Pipes Ltd. technicals for a more comprehensive analysis.
If you're still not sure, try looking for inspiration in our curated watchlists.
If you're still not sure, try looking for inspiration in our curated watchlists.