Hindustan Foods: Breakout or Bull Trap?🧿 Stock: Hindustan Foods Ltd
💸 CMP: ₹564.10
📆 Timeframe: Weekly + Daily Confluence
📍 Key Levels
• ⚡ Breakout Trigger: ₹567–570 (needs solid close above this)
• 🛡️ Immediate Support: ₹544–547 zone (daily 200 EMA cluster)
• 🧱 Strong Base: ₹526
📈 Chart Mood
• Trend: Sideways turning bullish
• Struc
Next report date
—
Report period
—
EPS estimate
—
Revenue estimate
—
9.75 INR
1.10 B INR
35.61 B INR
34.93 M
About Hindustan Foods Ltd.
Sector
Industry
CEO
Sameer Ramanlal Kothari
Website
Headquarters
Mumbai
Founded
1984
ISIN
INE254N01026
FIGI
BBG000BL3R43
Hindustan Foods Ltd. engages in the manufacture and distribution of cereal based food, extruded snacks, instant porridge, and extruded cereal products. It offers bonny mix, wheat, wheat apple, wheat mixed fruit, wheat vegetable, multi-cereal mixed fruit, and rice. It also involved in distribution of leather footwear. The company was founded on December 31, 1984 and is headquartered in Mumbai, India.
Related stocks

Hindustan Foods Ltd-Symmetrical Triangle Breakout!Hindustan Foods Ltd.—Symmetrical Triangle Breakout! 🚀📈
📅 Published on: April 12, 2025
📊 Chart Insight:
HNDFDS has broken out of a well-formed symmetrical triangle pattern on the daily chart, signaling a potential bullish continuation. The breakout is accompanied by a solid green candle and volume s

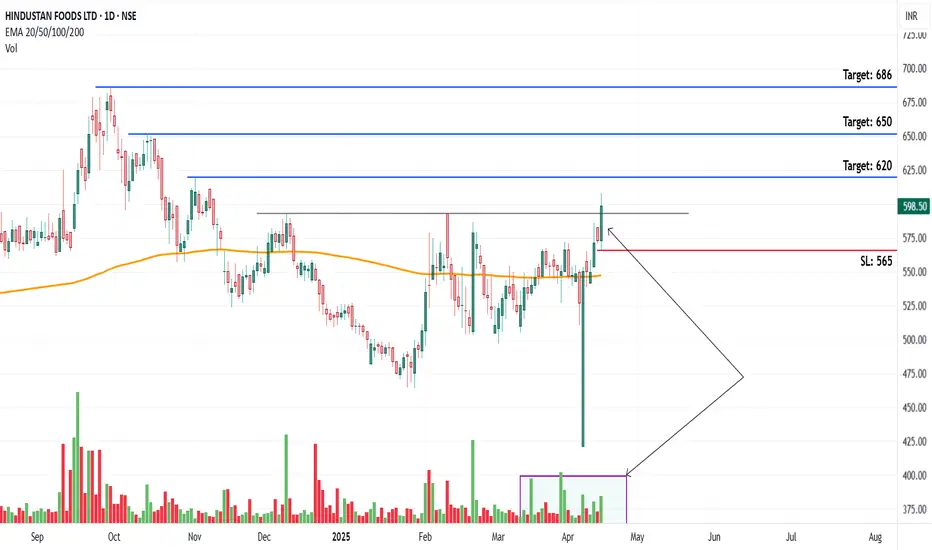
Breakout in HINDFDSChart -> Hindustan Foods Daily
CMP: 598
Good Range to Buy: 580 to 600
Targets: 620, 650, 686
SL: 565 Daily Close
Disclaimer: This is for educational purposes only, not any recommendations to buy or sell. As I am not SEBI registered, please consult your financial advisor before taking any action.
HINDUSTAN FOODS Swing Trade (Long)Strong buyers entered again trapping the sellers on monthly time-frame and making a liquidity pool.
On daily time-frame price is in up-trend and is going up by sweeping lows.
If Nifty holds current levels of 23000, (ie. if Nifty is not bearish) then there are high chances of
HINDUSTAN FOODS reach

HINDUSTAN FOODSStock Overview
Hindustan Foods Ltd, traded on NSE, current price: INR 564.90. The company specializes in manufacturing food products and beverages.
Key Levels
Support (Yellow Zone): INR 415.35 - INR 486.70
Swing Zone (Green Zone): INR 531.25 - INR 572.85
Target Levels (T): INR 726.30, INR 797.65, I

Hindustan Foods Nearing Breakout LevelHindustan Foods Ltd is nearing its breakout point at ₹625, currently trading at ₹578. A rise beyond ₹625 could initiate an upward trend, with possible targets at ₹640, ₹660, and ₹700.

HINDUSTAN FOODSGo Long Hindustan Foods
Entry Above Day High
Potential Buy in Yellow Zone
Stop Loss Below Swing Low
Target in Pink Zone
CRS is Rising.
Education Purpose Only.

swing opportunity Hindustan foods After having down fall from 748 its been consolidating in the trend line 2023 to 24sept. Recently the price has broken the trend line and going up, the price is above 50 ema and also 50 ema cross over 200 ema. wright now the price has taking the support of 50 ema. the stoploss mentioned in the chart

HNDFDS long viewNote: This is for educational purpose only.
Trendline breakout and retest done and price above 100 EMA close on WEEKLY TF

HINDUSTAN FOODS - Rounding bottom with huge volumesRounding bottom with huge volumes.
Targets(T1, T2, & T3) mentioned along with expected time frames. Stop loss marked as SL. Can achieve better targets, should carry trailing stop loss once in good gains.
Also keep tracking quarterly results to monitor performance.

See all ideas
Summarizing what the indicators are suggesting.
Neutral
SellBuy
Strong sellStrong buy
Strong sellSellNeutralBuyStrong buy
Neutral
SellBuy
Strong sellStrong buy
Strong sellSellNeutralBuyStrong buy
Neutral
SellBuy
Strong sellStrong buy
Strong sellSellNeutralBuyStrong buy
An aggregate view of professional's ratings.
Neutral
SellBuy
Strong sellStrong buy
Strong sellSellNeutralBuyStrong buy
Neutral
SellBuy
Strong sellStrong buy
Strong sellSellNeutralBuyStrong buy
Neutral
SellBuy
Strong sellStrong buy
Strong sellSellNeutralBuyStrong buy
Displays a symbol's price movements over previous years to identify recurring trends.
Frequently Asked Questions
The current price of HNDFDS is 527.90 INR — it has decreased by −1.33% in the past 24 hours. Watch Hindustan Foods Ltd. stock price performance more closely on the chart.
Depending on the exchange, the stock ticker may vary. For instance, on NSE exchange Hindustan Foods Ltd. stocks are traded under the ticker HNDFDS.
HNDFDS stock has fallen by −3.80% compared to the previous week, the month change is a −0.40% fall, over the last year Hindustan Foods Ltd. has showed a −19.26% decrease.
We've gathered analysts' opinions on Hindustan Foods Ltd. future price: according to them, HNDFDS price has a max estimate of 841.00 INR and a min estimate of 660.00 INR. Watch HNDFDS chart and read a more detailed Hindustan Foods Ltd. stock forecast: see what analysts think of Hindustan Foods Ltd. and suggest that you do with its stocks.
HNDFDS reached its all-time high on Dec 5, 2022 with the price of 749.00 INR, and its all-time low was 76.00 INR and was reached on Mar 20, 2020. View more price dynamics on HNDFDS chart.
See other stocks reaching their highest and lowest prices.
See other stocks reaching their highest and lowest prices.
HNDFDS stock is 1.90% volatile and has beta coefficient of 1.05. Track Hindustan Foods Ltd. stock price on the chart and check out the list of the most volatile stocks — is Hindustan Foods Ltd. there?
Today Hindustan Foods Ltd. has the market capitalization of 62.98 B, it has increased by 0.71% over the last week.
Yes, you can track Hindustan Foods Ltd. financials in yearly and quarterly reports right on TradingView.
Hindustan Foods Ltd. is going to release the next earnings report on Nov 18, 2025. Keep track of upcoming events with our Earnings Calendar.
HNDFDS net income for the last quarter is 317.30 M INR, while the quarter before that showed 307.50 M INR of net income which accounts for 3.19% change. Track more Hindustan Foods Ltd. financial stats to get the full picture.
No, HNDFDS doesn't pay any dividends to its shareholders. But don't worry, we've prepared a list of high-dividend stocks for you.
As of Sep 27, 2025, the company has 7 K employees. See our rating of the largest employees — is Hindustan Foods Ltd. on this list?
EBITDA measures a company's operating performance, its growth signifies an improvement in the efficiency of a company. Hindustan Foods Ltd. EBITDA is 3.00 B INR, and current EBITDA margin is 8.23%. See more stats in Hindustan Foods Ltd. financial statements.
Like other stocks, HNDFDS shares are traded on stock exchanges, e.g. Nasdaq, Nyse, Euronext, and the easiest way to buy them is through an online stock broker. To do this, you need to open an account and follow a broker's procedures, then start trading. You can trade Hindustan Foods Ltd. stock right from TradingView charts — choose your broker and connect to your account.
Investing in stocks requires a comprehensive research: you should carefully study all the available data, e.g. company's financials, related news, and its technical analysis. So Hindustan Foods Ltd. technincal analysis shows the strong sell today, and its 1 week rating is sell. Since market conditions are prone to changes, it's worth looking a bit further into the future — according to the 1 month rating Hindustan Foods Ltd. stock shows the sell signal. See more of Hindustan Foods Ltd. technicals for a more comprehensive analysis.
If you're still not sure, try looking for inspiration in our curated watchlists.
If you're still not sure, try looking for inspiration in our curated watchlists.