Hindustan Foods: Breakout or Bull Trap?🧿 Stock: Hindustan Foods Ltd
💸 CMP: ₹564.10
📆 Timeframe: Weekly + Daily Confluence
📍 Key Levels
• ⚡ Breakout Trigger: ₹567–570 (needs solid close above this)
• 🛡️ Immediate Support: ₹544–547 zone (daily 200 EMA cluster)
• 🧱 Strong Base: ₹526
📈 Chart Mood
• Trend: Sideways turning bullish
• Structure: Broke out after long consolidation
• Volume: Highest weekly volume in months = Accumulation clue
🧠 Trade Bias
• Above ₹570: Possible momentum towards ₹600+
• Below ₹544: Weakness, may revisit ₹520–500 zone
• Watch for a bullish retest — not a candle trap!
🎤 Mindset Cue:
“Breakouts backed by volume don’t lie. But wait for confirmation — not all green candles are green signals.”
#HindustanFoods #ChartSetup #PriceAction #SwingTrade #BreakoutWatch #NSEStocks #TechnicalView #VolumeSpike #StockTalkIndia #TradeSmart
Trade ideas

Hindustan Foods Ltd-Symmetrical Triangle Breakout!Hindustan Foods Ltd.—Symmetrical Triangle Breakout! 🚀📈
📅 Published on: April 12, 2025
📊 Chart Insight:
HNDFDS has broken out of a well-formed symmetrical triangle pattern on the daily chart, signaling a potential bullish continuation. The breakout is accompanied by a solid green candle and volume surge, hinting at strong momentum ahead.
🔍 Key Technical Highlights:
🔺 Pattern: Symmetrical Triangle (Lower highs + Higher lows)
📏 Breakout Level: ₹560
📈 Current Price: ₹571.65 (+4.03%)
📊 Volume Spike: 109.28K—a notable increase compared to recent sessions
📌 Support & Resistance Levels:
Immediate Support: ₹560 (breakout level)
Next Support (lower trendline): ₹530
Resistance Levels to Watch:
₹586 (minor supply zone)
₹615
₹645 (swing high)
📉 RSI Indicator:
Current RSI: 60.40—strong upward move, not yet overbought
Hidden Bullish Divergence (visible on chart): RSI made higher lows while price was consolidating—early bullish signal
Bearish markers now invalidated post-breakout
🧠 Trade Idea / Strategy:
📥 Buy on dips near ₹560–₹565 if price retests breakout
🛑 Stop-loss: ₹530 (below ascending trendline)
🎯 Targets: ₹586 ➡ ₹615 ➡ ₹645
📘 Note: Triangle breakouts typically indicate strong price movement after consolidation. Volume confirmation adds conviction.
🔔 Disclaimer: This chart is for educational purposes only. Do your own analysis or consult a financial advisor before investing.

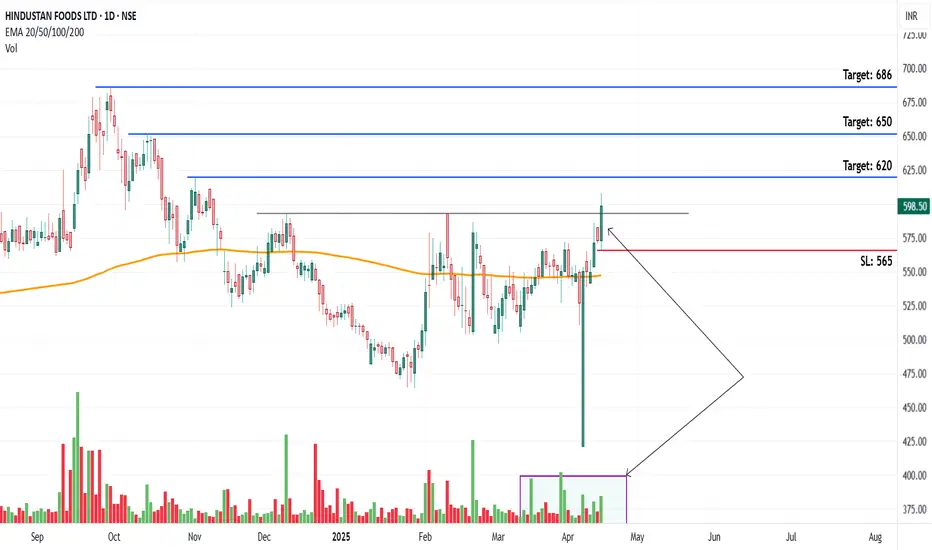
Breakout in HINDFDSChart -> Hindustan Foods Daily
CMP: 598
Good Range to Buy: 580 to 600
Targets: 620, 650, 686
SL: 565 Daily Close
Disclaimer: This is for educational purposes only, not any recommendations to buy or sell. As I am not SEBI registered, please consult your financial advisor before taking any action.
HINDUSTAN FOODS Swing Trade (Long)Strong buyers entered again trapping the sellers on monthly time-frame and making a liquidity pool.
On daily time-frame price is in up-trend and is going up by sweeping lows.
If Nifty holds current levels of 23000, (ie. if Nifty is not bearish) then there are high chances of
HINDUSTAN FOODS reaching the target levels.
1:5 Risk to Reward
Follow me for more such simple trade setups based on Trend and Liquidity.
Happy Trading!

HINDUSTAN FOODSStock Overview
Hindustan Foods Ltd, traded on NSE, current price: INR 564.90. The company specializes in manufacturing food products and beverages.
Key Levels
Support (Yellow Zone): INR 415.35 - INR 486.70
Swing Zone (Green Zone): INR 531.25 - INR 572.85
Target Levels (T): INR 726.30, INR 797.65, INR 888.45, INR 1,150.80
Technical Indicators
RSI (Relative Strength Index): Currently at 53.55, indicating neutral momentum as it is neither overbought (>70) nor oversold (<30).
Volume: 395.38K, reflecting active trading and interest in the stock.
MA (Moving Average): The stock price is above the 200-day moving average, suggesting a potential bullish trend.
Sector and Market Context
Hindustan Foods Ltd operates within the consumer goods sector, which has demonstrated resilience and steady growth. The broader market trend has been positive, with consumer goods stocks benefiting from increased demand and economic recovery.
Risk Considerations
Potential risks include:
Market volatility.
Shifts in consumer preferences.
Regulatory changes.
Economic downturns that could impact performance.
Analysis Summary
Hindustan Foods Ltd exhibits stable performance with clearly defined support and resistance levels. Technical indicators suggest a neutral to bullish outlook. Investors should consider the broader market conditions and sector performance while making decisions, keeping in mind the identified risks.

Hindustan Foods Nearing Breakout LevelHindustan Foods Ltd is nearing its breakout point at ₹625, currently trading at ₹578. A rise beyond ₹625 could initiate an upward trend, with possible targets at ₹640, ₹660, and ₹700.

HINDUSTAN FOODSGo Long Hindustan Foods
Entry Above Day High
Potential Buy in Yellow Zone
Stop Loss Below Swing Low
Target in Pink Zone
CRS is Rising.
Education Purpose Only.

swing opportunity Hindustan foods After having down fall from 748 its been consolidating in the trend line 2023 to 24sept. Recently the price has broken the trend line and going up, the price is above 50 ema and also 50 ema cross over 200 ema. wright now the price has taking the support of 50 ema. the stoploss mentioned in the chart by red line and 503 and 536 is the worst case. target will be 631,668,710, if it sustain we can see new higher highs.

HNDFDS long viewNote: This is for educational purpose only.
Trendline breakout and retest done and price above 100 EMA close on WEEKLY TF

HINDUSTAN FOODS - Rounding bottom with huge volumesRounding bottom with huge volumes.
Targets(T1, T2, & T3) mentioned along with expected time frames. Stop loss marked as SL. Can achieve better targets, should carry trailing stop loss once in good gains.
Also keep tracking quarterly results to monitor performance.

Hindustan food limited is on breakout with good volume spikeHello everyone, i have brought a stock which has given a breakout of triangle pattern with huge volume spike on weekly chart, there is higher probability that we will see bullish uptrend momentum in this.
Hindustan Foods Limited is an India-based company, which is engaged in contract manufacturing of various FMCG products including food, home care, personal care, beverages etc. They also do manufacturing of leather shoes and accessories.
Technically stock is looking good as it has given breakout of triangle pattern with good volume
Price is above 200-DEMA.
Macd is also giving bullish crossover.
Morgan stanley has taken position on bulk.
Market Cap
₹ 6,397 Cr.
Current Price
₹ 558
High / Low
₹ 630 / 461
Stock P/E
68.8
Book Value
₹ 56.4
Dividend Yield
0.00 %
ROCE
15.4 %
ROE
18.2 %
Face Value
₹ 2.00
Industry PE
40.5
Debt
₹ 730 Cr.
EPS
₹ 8.12
Promoter holding
63.8 %
Intrinsic Value
₹ 256
Pledged percentage
0.00 %
EVEBITDA
30.9
Change in Prom Hold
-1.04 %
Profit Var 5Yrs
50.9 %
Sales growth 5Years
41.1 %
Return over 5years
43.8 %
Debt to equity
1.13
Net profit
₹ 93.0 Cr.
ROE 5Yr
18.2 %
Profit growth
30.8 %
Earnings yield
2.61 %
Disclaimer:- Please always do your own analysis or consult with your financial advisor before taking any kind of trades.
Dear traders, If you like my work then do not forget to hit like and follow me, and guy's let me know what do you think about this idea in comment box, i would be love to reply all of you guy's.
Thankyou.

HINDUSTAN FOODS: Aggressive volumeHindustan Foods is on radar due to heavy buying and a breakout ready stock. On daily time frame it is showing it can retrace downside level of 500-490. Short term targets like 570-600 can be achieved soon.
NOTE: I'm not a SEBI REG. Study charts before investing.

Hindustan Food Stock - Bullish Flag Pattern
Hindustan Food (HINDUNILVR) is exhibiting a classic bullish flag pattern on the daily chart, indicating a potential continuation of the upward trend. Here’s a detailed analysis and structured description for trading targets once the pattern is broken with significant volume.
Key Points:
Pattern Identification:
Hindustan Food stock is currently forming a bullish flag pattern, characterized by a sharp price rise (flagpole) followed by a consolidation phase (flag) with downward sloping trendlines.
Volume Confirmation:
A breakout from the flag pattern should be accompanied by high trading volumes to confirm the bullish momentum. Watch for volume spikes at the breakout point.
Entry Point:
Enter the trade when the stock price closes above the upper resistance trendline of the flag pattern with significant volume. This confirms the breakout.
Target Levels:
T1 - 739: The first target is set at 739, derived from the height of the flagpole added to the breakout point.
T2 - 1000: The second target is set at 1000, a psychological level and an extension of the initial flagpole projection.
SL - 436: The stop-loss is placed at 436, below the lower support trendline of the flag pattern to manage risk.
Trade Management:
Monitor the trade actively and consider trailing the stop-loss to lock in profits as the stock moves towards the target levels.
If the stock shows signs of reversal or fails to sustain above the breakout level, reassess the position to minimize losses.

HNDFDS- SG self finder monopolyHNDFDS- SG self finder monopoly
1) Good Monopoly Stock
2) BEst level
3) Lets see the Burst

Hindustan Foods LtdIts near its 52 Week low.
Promoter Holding is good & No promoter Pledged.
Demand Zones are marked as Green shaded horizontal areas.
Resistances are marked as red horizontal lines.
Stoploss is marked as orange horizontal line.
Levels 1:-
Buy Near 480
Stoploss 430
Positional Tgts 620 - 730
Levels 2:-
Buy Near 330
Stoploss 260
Positional Tgts 400 - 480
Long Term Tgts 620 - 730
This idea is for Educational purpose and paper trading only. Please consult your financial advisor before investing or making any position. Facts or Data given above may be slightly incorrect. We are not SEBI registered.

HINDUSTAN FOODSNote:
1. Views are personal and for educational purposes only. Recheck and take the trade as per your RR.
2. Always remember SL is your lifeline, not the big target...
3. Follow us for more patterns and like, share so that we feel it is helpful to many and share more patterns...
3. Views given here is not a tip rather it is for educational purpose... Aftermarket opens, the condition might change so learn to handle different conditions...
Keep an eye ladies and gentlemen. Cheers and Happy Trading

HNDFS- Breakout Ready After low volume accumulationHNDFS- Breakout Ready After low volume accumulation

HNDFS - Ready for Run upHNDFS - Ready for Run up
1) Entered support Zone
2) Already tested on lower time frame
3) Stock fundamentals are also good

Hindustan Foods 5 month high breakout. Closed above 50 and 200 Dema + higher than average volume + positive macd.

Hindustan Foods Limited. TRIANGLE PATTERN BREAKOUT Hindustan Foods Limited is an India-based company, which is engaged in contract manufacturing of various FMCG products including food, home care, personal care, beverages etc. They also do manufacturing of leather shoes and accessories

Bullish breakout in bearish marketHindustan foods has given a bullish flag breakout.
Risky trade considering weak market scenarios.
Levels mentioned on chart.
Its better to book quick profits or keep on trailing your SL.
Idea shared for educational purposes

BUY TODAY SELL TOMORROW for 5% DON’T HAVE TIME TO MANAGE YOUR TRADES?
- Take BTST trades at 3:25 pm every day
- Try to exit by taking 4-7% profit of each trade
- SL can also be maintained as closing below the low of the breakout candle
Now, why do I prefer BTST over swing trades? The primary reason is that I have observed that 90% of the stocks give most of the movement in just 1-2 days and the rest of the time they either consolidate or fall
Trendline Breakout in HNDFDS
BUY TODAY SELL TOMORROW for 5%

HNDFDS 1WTRADING COMMUNITY
JOIN US ONLY IF YOU WANT PEACE AND PROFIT IN YOUR TRADING LIFE.
I am not a call provider, not SEBI approved person. All the charts and PnL here are for educational purposes. Consult a professional financial advisor before you invest.
