VIStock is very weak look for shorting opportunity. Levels mentioned on chart. If you have holdings I recommend hedging
IDEA trade ideas

IDEA might declare BANKRUPT read description for story& fundaDO not go and short
if you have shares you might exit or hold its your own descision as this is not a trading call kindly refer disclaimer i am just warning for educational purposes
smart investors might have exited by now that is the reason few days back idea share fell more than 10%
you can check balance sheet from 2017 idea is posting continuous loses , in 2016 is where reliance entered the market with jio ,that effected the market of idea greatly
few days back i some where read an article on auditors questioning on idea sustainability
later just today i found ref- "business today, that vodafone idea in talks for fund raise says floor price "best fix for pricing issues" this might be a retailer trap ,few months back similar case with lakshmi vilas bank they where about to delist the stock felt lower circuit later they declared that they are gonna fight case in court the news is made up
and retailers seeing the news got trapped later that day stock was to 5-7% up and later got delisted ,so better exit in risk based stocks where funda are very very weak
coming to its financials it has now debt more than 1.25 lakh crores where the interest paid alone is more than profit made, share holders funds went to -38000 crore went into negative now i think promoters might not support the stock from here on ,no one still holds a losing business so any positive news might be a trap
disclaimer- this is not any investment call or idea , this just my view and it can go wrong ,this is only for educational purposes trade at your own risk and i am not saying any news is false or true just posting my opinion and interpretation
#vodafoneidea 8.8it need to stay above 7.15 to touch 8.8-11.45. support at 6.95 - 5.3 on monthly closing basis

vodafoneideasupport between 5.35-5.2. below it targets are on charts. upside pattern only above 6.45

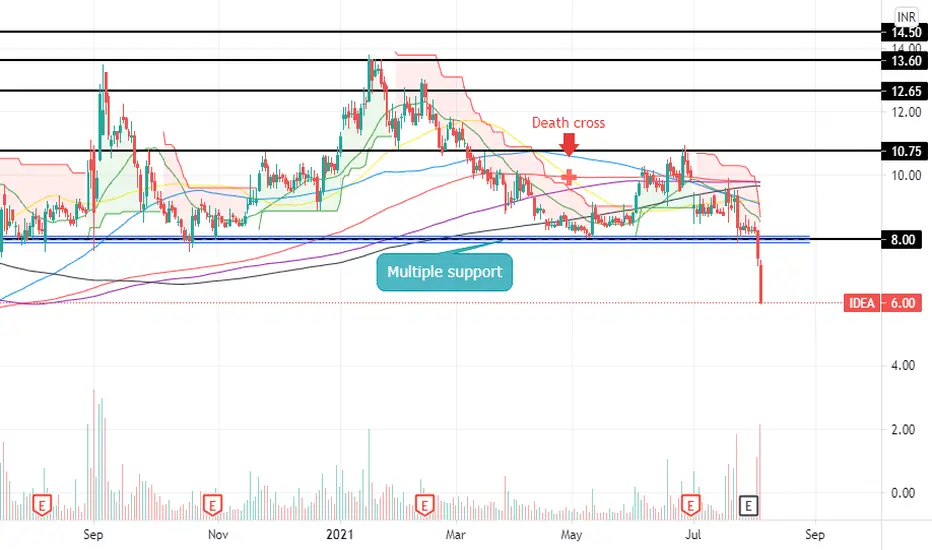
IDEA LTD.VODAFONE IDEA LTD.
DATE - AUG 04, 2021.
Formation of DEATH CROSS in IDEA and sharp fall in share price.
Idea breaks multiple support level.
1.The death cross is a technical chart pattern indicating the potential for a major selloff and has proven to be a reliable predictor of some of the most severe bear markets of the past century, including 1929, 1938, 1974, and 2008.
2.The death cross appears on a chart when a stock’s short-term moving average, usually the 50-day, crosses below its long-term moving average, usually the 200-day.


Idea: Short Term Money Making MachineThe idea is the oldest telecom company that is struggling today with consolidate time today as facing consolidated zone in recent days.
But we can observe it as a money making machine in short term trades
When we put it on daily charts it's support and resistances are as follows:
1st Support: 8.45
2nd Support: 8.80
If it crosses 8.80 then it can show you the levels of 8.45. The buying zone is 8.80 and 8.45
1st Resistance: 9.30
2nd Resistance: 9.70
If it crosses 9.30 & 9.70 then it can again show you the targets of 10.30 and more.
The stock is also taking support on its 50 days moving average it means it is in an uptrend right now.
So, GO GET IT
I am not a SEBI registered broker. So, take the legal advice of your broker before entering into trade.

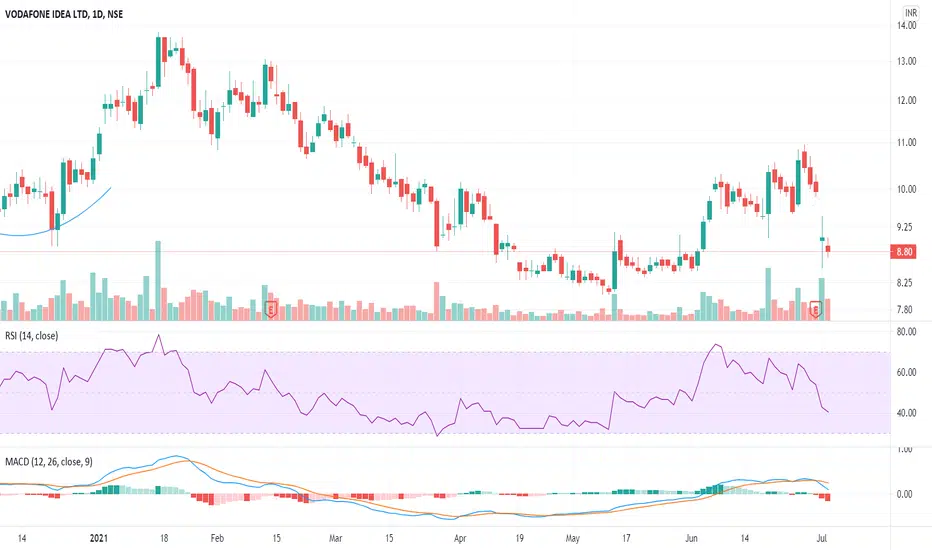
RSI VS PRICE DIVEREGENCE IN VII have noticed an RSI VS PRICE Divergence on VI chart. Here the price is constant, whereas RSI has declined over the same period. Feel free to comment with your understanding of the same. How will the price reacts because of this.


vodafone idea SHORT TERM VIEWAscending Triangle Pattern FORMED
This is NOT investment advice. This chart is meant for learning purposes only. Invest your capital at your own risk.

IDEA : Nice BUY coming.. My Chauhan's view wave analysis suggest a nice buy coming - a good investment opportunity.
DO not miss it.
Happy Trading.

Candlestick Patterns to become a Successful TraderCandlestick patterns, which are technical trading tools, have been used for centuries to predict price direction.
There are various candlestick patterns used to determine price direction and momentum, including three line strike, two black gapping, three black crows, evening star, and abandoned baby.
However, it’s worth noting that many signals emitted by these candlestick patterns might not work reliably in the modern electronic environment.
It's the BASICS... sometimes as traders its best to stick to the basics , your trade run better when you go with the trend o the market.
Bull market buys, Bear market sells....
You will see a huge difference in your results when this is done. Scalping is great but overall trend is key.
The saying is set true "TREND IS YOUR FRIEND"

IDEA_LOOKS GOOD ON CHARTVI (IDEA) looks good to go long on the chart.
(for educational purpose only)


VI WILL BE DOWN TO 10 BY AUGUSTJust by looking at the market, it's declining and reporting 7000cr in losses. By looking at the pattern of their QY losses and will increase as the spread of JIO and Airtel customers.

IDEAI personally do not trade in stocks which are priced so low, but the chart pattern is interesting.

Vodafone Idea making a cup Pattern Wait and WatchVodafone Idea making a cup Pattern.
Vodafone Idea was moving in a Channel from June 2020 till April 21 and started making a Cup Pattern.
There is a strong resistance at 13.30-13.80 from where it reversed earlier. The next resistance is at 11.85.
So a decisive break and retest above 11.85 could provide an opportunity to go long for a target of 13.50. Put on watch list.
