Idea Long you can see 3 head and shoulders and the channel ,,we can see the price crawl on lower trendline of the channel so it may soon bounce from there .
IDEA trade ideas

idea has a target of 11stock is forming a shark pattern with the D point at 11.o5 whicj incidentally intersects the curved trend line also


Fundamentals may be weak but technical analysis indicates rise Fundamentals may be weak but technical analysis indicates rise in stock price.
See how beautifully fib retracement is followed. Also shoulder pattern if formed. The stock price will rise for sure in future.

Bad result I don't expect vi to perform goodI didn't expect it to perform good anymore as the reported loss is 7400 crores. All investors are exiting the company due to poor growth

Clear resistance marked sell and by at lower levelsThis all are idea resistance. price can fall from this levels mark it on your charts and sell and reenter once it come down
Making profit is important in stock market think of people who got stuck at higher levels in vi around 50-100 levels

IDEA Positional Analysis CMP 9.3 buy for target 12- 13-15-18IDEA Positional Analysis
CMP 9.3
buy for target 12- 13-15-18-25-+
sl below 8 rs
holding period 3-5 years


LongLong term view for good returns
No bulky investment suggestions just for the money what dont hurts you chart says it might jump anytime in coming weeks

Probable upmove coming in IDEAIt is clear from the chart that IDEA has already made a symmetrical triangle pattern
And broke that with a strong bullish candle (Proving strength)
Now it made Flag & Pole pattern.
Which indicates a swing trading opportunity upto 9.35 - 9.50 level. (On the tine of publishing idea LTP was 8.8).
SL 8.20 is a must.
And also the stock is at strong support on weekly timeframe

Vodafone - Idea If it had to bounce this was the perfect level 08.00Rs as per fib golden level 0.618, also it had taken support on same level 3 times , if it breaks this level it will be weak enough to touch approx. 6.00 rs level which is also a bottom of highlighted channel in light yellow, however it is a good sign to bounce from the same level where it took support 3 times, now upside i see a target of 22-25 rs in 6 mnth - 1yr may be as per previous data analysis , where it meets the bigger channel drew in light green, 16- 17 rs would be its 1st hurdle or can say point of profit booking as per previous channel high where it would also face resistance from Ema 200, which it has not broken since 2012. If we check RSI formation it broke its descending trendline and retested the same and now is upwards. all signs and analysis shows bullishness for coming few months.

IDEA poll and flag donePoll and flag Done
chances for DOUBLE BOTTOM
poll and flag pattern is very common in trading because it is very easy to catch and chances for target is very high

Vodafone idea long term analysis Recently monthly chart of Vodafone idea breaks the Trend line. We can see sharp fall in monthly chart. If Vi does not sustain this level the next support will be 5.2 and 4.55. As per current price action looks like Vi can get up to 1.5 Rs or may be less than that.
Desclaimer : This is my view as per current price action. If price pattern changes also change my view. This is not any buy or sell recommendation.

Idea Chart Analysis !!📈 Idea 📉
My Findings :-
1. Breakdown of Support Zone.
2. Breakdown of Head and Shoulder Pattern.
3. Close below Seven Month Low.
Bias- Short
Target- 7.95 and 5.75
SL- 11.55
RR- 1: 1.5
All Important Supports and Resistances are drawn in chart.
All levels are of Spot and on closing basis.
Disclaimer : Consult Your Financial Advisor Before Taking Any Decision On This Analysis.

Idea is one of the leading telecom service providers in IndiaVodafone Idea is one of the leading telecom service providers in India. The Company is engaged in the business of Mobility and Long Distance services, trading of handsets and data cards.

Vodafone Idea- Decent Results, Volumes picking up in the counterVodafone idea, decent results this quarter added new subscribers and ARPU increased.
IF it maintains the momentum, the stock may see upside with targets and stop loss set on the charts.
*** Do not trade more than 1 % of your trading capital in this counter ****
****Educational Content . Not a Recommendation ****

0.786.. the idea factoridea previously bounced from 0.786 fib retracement.. this time too it is the last and strong recognised support which seems to be hold.. placed a buy order @ 7.30 with stoploss @4.55. lets see


How To Read Neowave Charts by Neowave ForecastHello Traders and Investors
My Name is Manish Singh and i am an expert in Neowave. In this chart i have describe the coding method to read my charts.
In Neowave Charts Degree labels used as intermediate, primary and cycle degree which is hard to understand by new user. Actually they understand 1 to 5 labels but they dont get the quiet idea in one look in which trend is this count is given. Thats why i came up with something simpler. So i am publishing this in the hope they everyone new trader easily understand the chart that it is in corection or in motive wave and for what time frame.
As they follow my charts, than with time they will understand which degree takes how much amount of time approximately to complete its structure and it surely does in learning the neowave.
Anyway friend kindly tell how you like the idea of this kind of coding.
I am also puting some examples of chart here.
1) This is the chart of nifty in which long term wave is in correction and you can judge with the help of medium wave degree that where is long term wave correction can end or actually new trend is going to start now or it become a failure. you can judge the chart pattern with is also as you can see this is an flat structure.
2) This is another chart of USD/JPY
In this chart i have used the old style of coding so that you can compare which one is easier to understand trend. As you can clearly understand with the help of count that it is going up but you were unable to catch that in which degree it is up or how long it will sustain there. Is there much bigger degree from the current one i am seeing.

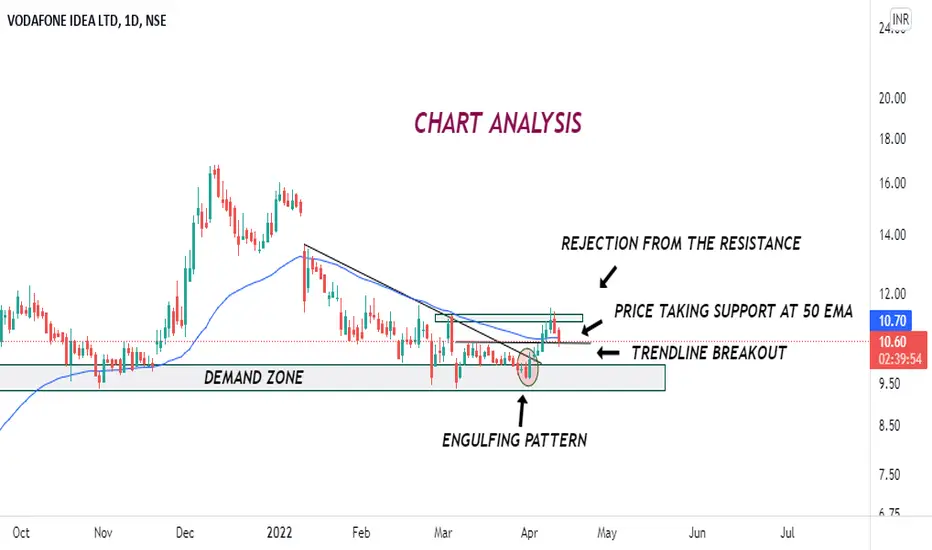
Bullish on IDEAPull back from the demand zone
Engulfing pattern
Trend line Breakout
Rejection from resistance zone
Taking support at 50 EMA
vodafoneidea 18.85it need to stay above 12.2 to be in bullish zone. above 13 close can take it to 18-19 level. invalid below 10.

iDEA FOR FUNIdea can blast anytime. I am going to invest little money just for fun and experiment. This is not my recommendation.

Vodafone Idea, a multibagger in makingVodafone Idea has immediate target of INR 17 and once it manages to stay above the weekly trendline, it will create a Bullish Wolf Wave and it can be expected to run upto INR 45
