IKS Price ActionInventurus Knowledge Solutions Limited (IKS) is currently trading around ₹1,680 as of late November 2025, showing a slight intraday decline of about 0.9%. The stock price is positioned between its 52-week low of approximately ₹1,237 and 52-week high near ₹2,189, reflecting a mid-range consolidation phase. Recent quarterly performance shows solid financials with year-on-year revenue growth of over 20%, a net profit increase close to 60%, and an EPS of around ₹10.58 in Q2 FY26.
Key technical levels include a support zone near ₹1,550-1,570 and resistance around ₹1,660-1,700, with moving averages around ₹1,570 acting as important pivot points. The stock carries a high price-to-earnings ratio near 46, indicating a premium valuation relative to earnings. Momentum indicators like RSI and MACD suggest mild bullishness but with some caution due to volatility and mixed short-term signals. Volume levels are moderate with a delivery percentage around 60%, implying relatively stable investor interest.
For trading, it is advisable to watch for price actions near support for potential buying opportunities targeting resistance levels, while short positions may be considered if price fails to hold breakouts above resistance, always with tight stop-losses given the stock's volatility and premium valuation. Upcoming earnings releases are key catalysts to monitor for directional confirmation.
Inventurus Knowledge Solutions Limited
No trades
Market insights

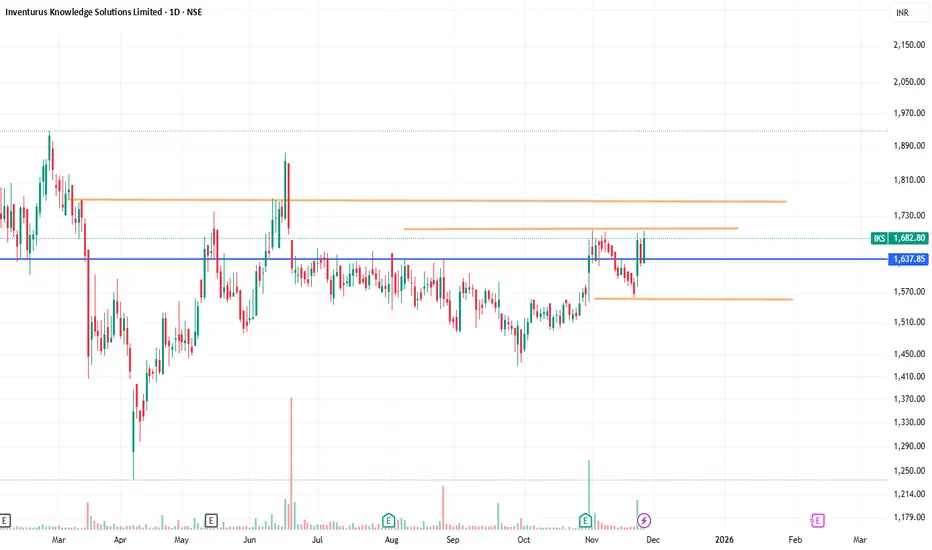
Inventurus Knowledge cmp 1696 by Daily Chart view since listedInventurus Knowledge cmp 1696 by Daily Chart view since listed
- Support Zone 1475 to 1575 Price Band
- Resistance Zone 1755 to 1855 Price Band
- Falling Price Channel Breakout well sustained
- Resistance Zone Breakout maybe decently expected
- Rising Price Channel Uptrend momentum going firmly
- Volumes are in close sync with average traded quantity
- Bullish Rounding Bottoms or considerate Cup and Handle don

Inventurus Knowledge Solutions LtdInventurus Knowledge Solutions Ltd
a good consolidatiion is going from past 1 month and the volume is slowly gradully increasing it means their is some buying coming and we can see a strong potential breakoutt supoorted by Fundamental as earning and cash flow both are increasing
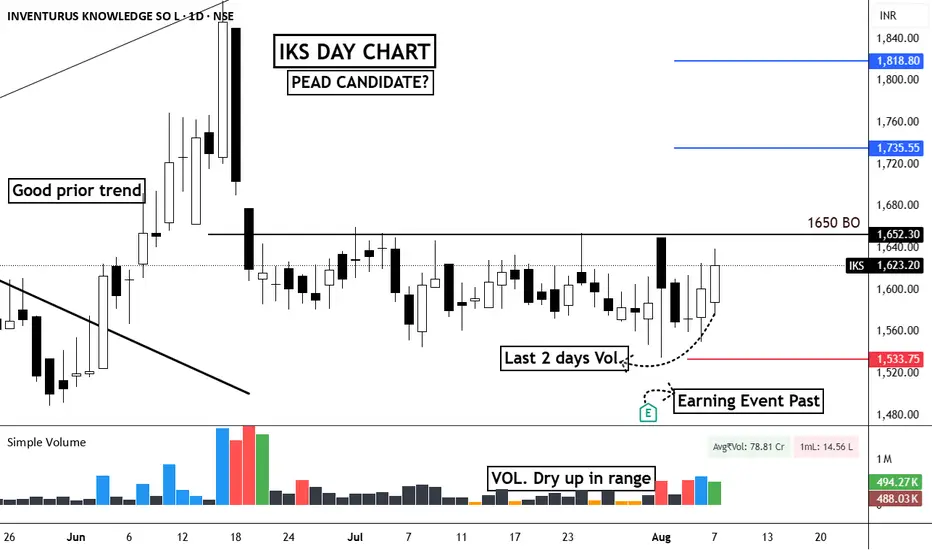
PEAD in Inventurus Knowledge (IKS)EQUITY SWING SETUP 📊
#IKS | Daily Chart Analysis
🔹Structure:-
Price is forming a rounded bottom inside a range, showing Volume Dry-Up during the consolidation phase.
Earnings event is past, reducing uncertainty, and the last two days show pickup in volume, hinting at accumulation.
Key breakout level is ₹1650, above which momentum can accelerate — possible PEAD (Post-Earnings Announcement Drift) candidate.
🟢ENTRY:
Buy above ₹1655 with strong volume confirmation.
♦️RISK:-
Stop Loss: ₹1533 (below recent swing low & support zone)
🎯TARGETS:-
1st Target: ₹1735
2nd Target: ₹1818
📌Detailed Analysis:
Volume dried up significantly during the range, a classic sign of weak hands exiting.
The base is tight, indicating strong hands holding.
Breakout above ₹1650 could trigger a quick momentum burst, especially given the post-earnings context.
Watch for strong volume on breakout day to confirm institutional participation.
📈Mark the levels on your chart and track price behavior near the breakout zone.
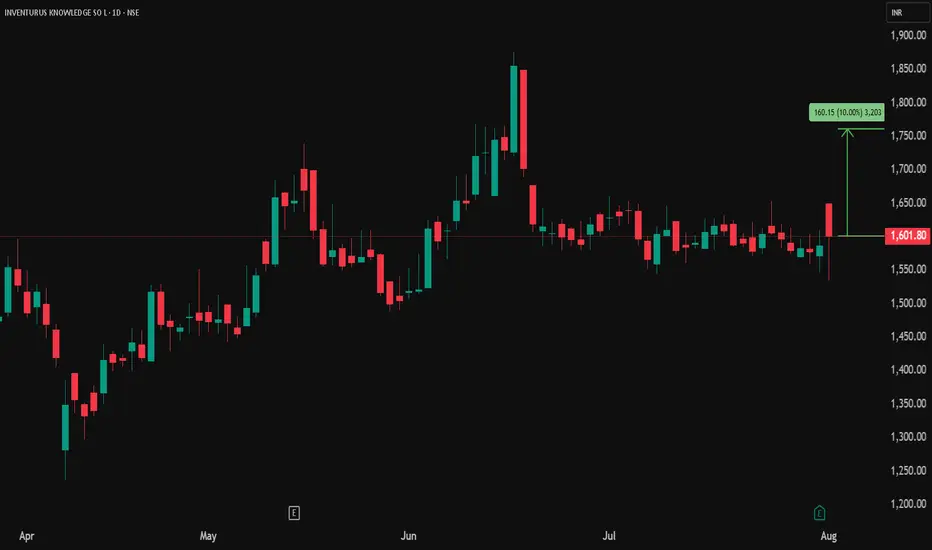
Technical Analysis – Inventurus Knowledge (IKS.NSE)### 📈 **Technical Analysis – Inventurus Knowledge (IKS.NSE)**
**As of 3rd August 2025 | CMP ₹1,601.80 | NSE: IKS**
#### 🔹 **Price Action & Structure**
* The stock is trading at ₹1,601.80, showing a strong bullish candle following a **clean breakout from a consolidation zone** (₹1,500–₹1,580).
* The price has reacted **sharply post-earnings**, gapping up and attempting to retest prior highs from June.
* **Volatility expansion** is evident with a wide-range bullish bar, indicating institutional participation.
#### 🔹 **Support & Resistance**
* **Immediate resistance**: ₹1,750 (indicated by the 10% projected target and previous price cluster from June highs).
* **Immediate support**: ₹1,535–₹1,550 zone (yesterday’s low and recent base).
* If ₹1,750 is decisively breached, next leg up may extend toward **₹1,875–₹1,900**, aligning with the June swing high.
#### 🔹 **Trend Structure**
* The broader trend remains **upward** with higher highs and higher lows since April 2025.
* Price recently broke out from a **7-week range**, suggesting **accumulation breakout**.
* The July base-building followed by earnings surprise is **textbook consolidation before expansion**.
#### 🔹 **Candlestick Insight**
* Today's candle is a **strong bullish engulfing pattern**, supported by volume (if confirmed by the exchange).
* The wick rejection on the downside shows demand zone near ₹1,535 is holding well.
#### 🔹 **Moving Averages (Not plotted, but relevant)**
* Assuming standard indicators, price likely trades **above its 20, 50, and 200 DMA**, reinforcing a bullish bias.
* Any retest toward short-term averages may offer low-risk entries.
---
### ⚙️ **Fundamental Overlay**
* Q1 FY26 results show **YoY EPS growth of 59%**, net profit ₹152 Cr vs ₹95.5 Cr YoY.
* Sustained growth in margin and profitability justifies **valuation re-rating**.
* At a PE of 50.7, the market is pricing in **high growth expectations**, but supported by real earnings momentum.
---
### 🧠 **Analyst Takeaway**
> *“Inventurus Knowledge is breaking out of a prolonged consolidation with fundamental tailwinds acting as catalysts. A close above ₹1,650–₹1,700 could trigger a move toward ₹1,750 and eventually ₹1,900. Traders should watch for sustained volumes above resistance, while long-term investors may accumulate on dips toward ₹1,550 with a growth conviction lens.”*
📌 Disclaimer: This is not a recommendation to buy/sell. Please consult your financial advisor.
🔒 Not a SEBI registered analyst. Views are personal and for educational purposes only.
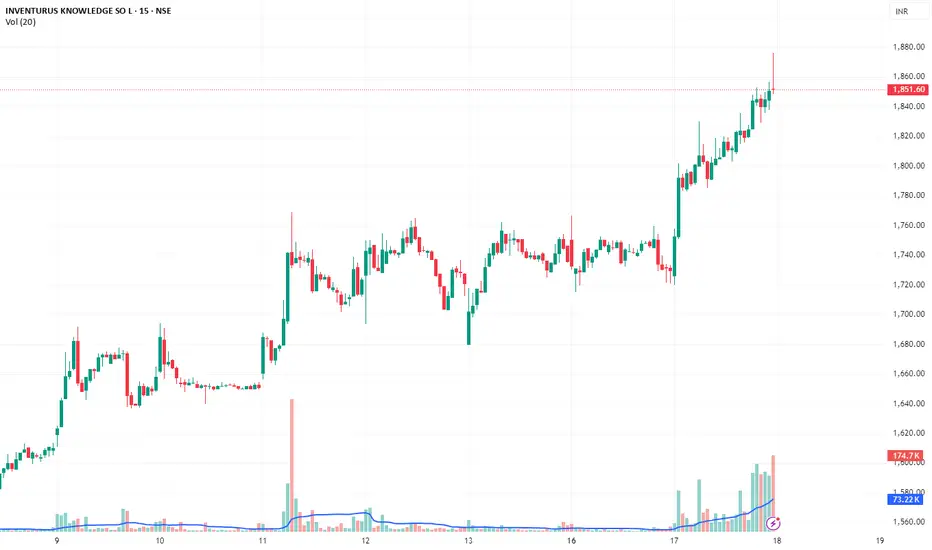
INVENTURUS – Fresh Volume Breakout With Momentum Build-upINVENTURUS – Fresh Volume Breakout With Momentum Build-up
CMP ₹1855.70 | Time Frame: 5-min | Date: June 17, 2025
🔍 Chart Observations:
After a quiet range-bound move on June 14–16, the stock gave a sharp vertical breakout around 9:45 AM on June 17 from ~₹1,755 to ₹1,800.
This was followed by gradual higher highs and higher lows, forming a classic intraday bullish staircase pattern.
Strong volume expansion in the last 60–75 minutes, especially on bullish candles, suggests accumulation by smart money.
The final push to ~₹1,880 was accompanied by the highest volume bar of the day, followed by a minor profit-booking candle — which is healthy.
📈 Momentum Setup & Trade View:
✅ Trend confirmation via:
Volume consistently rising above 20-period average (blue line)
Structure of rising demand zone with no significant bearish engulfing candle
Price is currently consolidating near ₹1855–1860 after a peak at ₹1880 — which is a bullish continuation zone.
📌 Key Levels:
Immediate Resistance: ₹1,880 / ₹1,900 (breakout level)
Support: ₹1,825 (VWAP/structure base) / ₹1,800
Volume Threshold: Above 45K on bullish candles supports momentum extension.
🔮 Bullish Probability (Next 3–4 Days):
🔸 Moderately High (~80%) – Strong price and volume setup. Likely to test ₹1,880+ again and could move toward ₹1,930–1,950 on follow-through buying.