When Fear Peaks, Emotion Speaks – Market Mood Index at an ExtremToday, the market entered a rare emotional extreme.
The Market Mood Index (MMI) dropped to 10, a level that reflects deep fear and emotional exhaustion. Readings like this don’t come from logic or long-term conviction — they emerge from panic, uncertainty, and forced selling.
Such moments are unco
India VIX Index
No trades
Related indices

Algorithmic Trading: The Future of Financial MarketsUnderstanding Algorithmic Trading
Algorithmic trading refers to the use of computer programs and predefined rules to automatically place buy and sell orders in financial markets. These rules are based on factors such as price, volume, time, technical indicators, statistical models, or even artifici

Divergence Secrets Risks Involved in Options Trading
While options offer attractive opportunities, they also carry significant risks:
Time Decay (Theta): Option value decreases as expiration approaches.
Volatility Risk: Changes in market volatility can impact option prices.
Unlimited Loss for Sellers: Option write

A Stock Market Crash Warning for the Indian MarketRupee Bubble About to Pop?
In recent months, concerns have been rising among investors, economists, and market participants about whether the Indian rupee is being artificially supported and whether a potential “rupee bubble” could burst, triggering turbulence in the stock market. While India remai

Profits from Calls and PutsUnderstanding Calls and Puts
A call option gives the buyer the right, but not the obligation, to buy an underlying asset (such as a stock, index, or commodity) at a predetermined price called the strike price, on or before a specified expiry date. A put option gives the buyer the right, but not the

Part 12 Trading Master ClassTypes of Options: Calls and Puts
Options are broadly divided into two categories:
A. Call Option
A Call option gives the buyer the right to buy an asset at a fixed price (strike).
You buy a Call if you expect the market to rise.
You sell a Call if you think the market will stay below the strike

INDIA VIX AT ALL TIME LOWIf india VIX stay below 9.3 till this month end then the monthly candle will close at all time low.
Even the yearly candle will close at all time low.
Previously it made low of 8.15 but the candle never closed below 10 since 2011.
Caution : option sellers

Chart Patterns: Deep, Easy & Practical GuideWhy Chart Patterns Matter
Every candle represents a war:
Buyers want price higher, sellers want price lower.
When multiple candles form repeated structures — triangles, flags, W-shaped patterns — it signals:
Market exhaustion
Momentum imbalance
Consolidation before expansion
Liquidity grabs
T

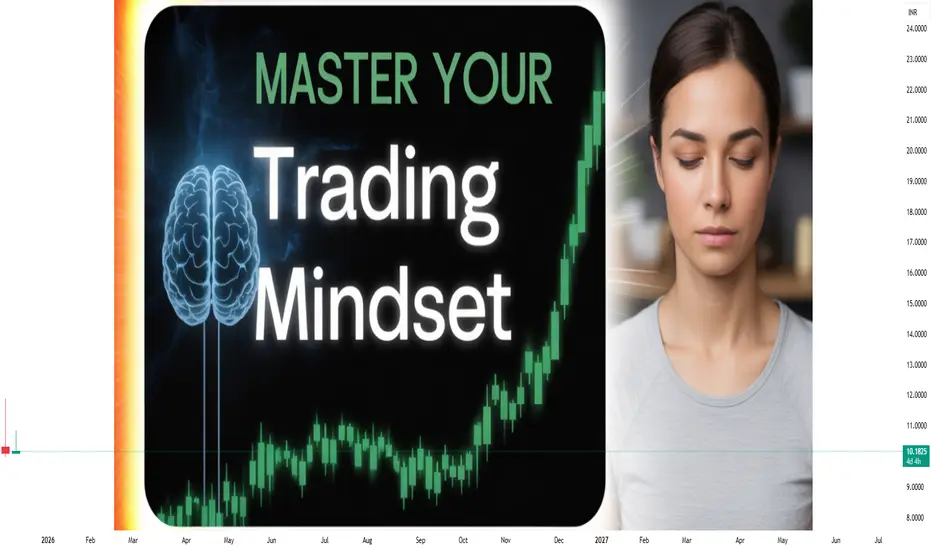
Master Your Trading MindsetThe Psychological Edge Behind Consistent Market Success
In the world of trading, strategies, indicators, and market knowledge are important, but they are not the ultimate deciding factors between success and failure. The true differentiator is mindset. Many traders enter the markets believing that m
Part 4 Learn Institutional Trading In the Money (ITM), At the Money (ATM), Out of the Money (OTM)
Depending on the strike price relative to the current market price, options are classified as:
ITM Options
Have intrinsic value.
Call: Strike < Spot
Put: Strike > Spot
ATM Options
Strike = Spot (approximately)
Mostly time value.

See all ideas
Summarizing what the indicators are suggesting.
Oscillators
Neutral
SellBuy
Strong sellStrong buy
Strong sellSellNeutralBuyStrong buy
Oscillators
Neutral
SellBuy
Strong sellStrong buy
Strong sellSellNeutralBuyStrong buy
Summary
Neutral
SellBuy
Strong sellStrong buy
Strong sellSellNeutralBuyStrong buy
Summary
Neutral
SellBuy
Strong sellStrong buy
Strong sellSellNeutralBuyStrong buy
Summary
Neutral
SellBuy
Strong sellStrong buy
Strong sellSellNeutralBuyStrong buy
Moving Averages
Neutral
SellBuy
Strong sellStrong buy
Strong sellSellNeutralBuyStrong buy
Moving Averages
Neutral
SellBuy
Strong sellStrong buy
Strong sellSellNeutralBuyStrong buy
Displays a symbol's value movements over previous years to identify recurring trends.