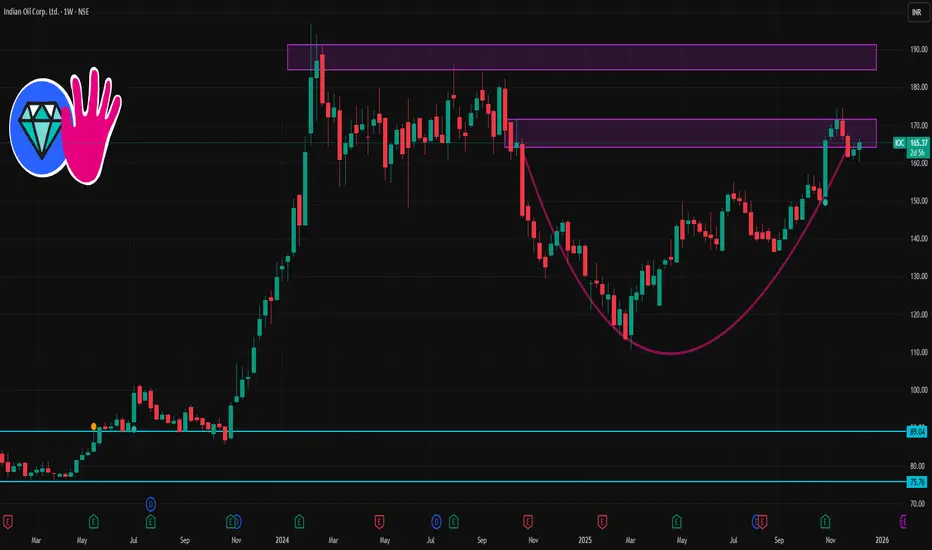
IOC – Classic IHNS Pattern Showing Accumulation Before BreakoutThis chart is a textbook example of an Inverse Head and Shoulders pattern forming after a decline.
First, price made a low (left shoulder).
Then it dropped deeper and formed the head.
After that, it made a higher low (right shoulder), showing selling pressure is weakening.
Now price is consolidati
Next report date
—
Report period
—
EPS estimate
—
Revenue estimate
—
25.97 INR
135.98 B INR
7.57 T INR
3.74 B
About Indian Oil Corp. Ltd.
Sector
Industry
Website
Headquarters
New Delhi
Founded
1959
IPO date
Oct 9, 1995
Identifiers
2
ISIN INE242A01010
Indian Oil Corp. Ltd. is a holding company, which engages in refining, pipeline transportation, and marketing of petroleum products. It also explores and produces crude oil and gas; and markets natural gas and petrochemicals. It operates through the following business segments: Petroleum Products, Petro-Chemicals, and Other Businesses. The Other Businesses segment covers the sale of gas, explosives, and cryogenics; wins mill and solar power generation; and oil and gas exploration activities. The company was founded on June 30, 1959 and is headquartered in New Delhi, India.
Related stocks

IOCIOC
bullish trend is Showing on the chart.
buy signals in
technical indicators and
cup with handle & ascending triangle chart pattern.
BUYING RANGE 172/175
Watch for a breakout above 172/175 to sustain the bullish trend. If the resistance holds, there could be a retest towards 150/155 and an upt

IOC 1 Day time Frame 📊 Current Daily Price (Live / Latest)
Current price: ~₹162.8 – ₹163.8 (NSE) on 29 Jan 2026 during the session.
Today’s range so far: Low ~₹161.7, High ~₹164.6.
📈 Key Daily Levels (Support & Resistance)
📌 Immediate Support
S1: ~₹161.0 – ₹161.8 — today’s low region.
S2: ~₹158.6 – ₹159.0 — short‑term

IOC 1 Month Time Frame 📌 CURRENT PRICE (as of 22 Jan 2026)
IOC share price: ~₹159.9 per share (NSE/BSE).
📊 1‑Month Technical Levels (Current & Accurate)
Resistance (Upside Levels)
These are levels where price may find selling pressure in the near term:
R1 – Immediate Resistance: ~₹160.6–₹162.5
R2 – Mid Resistance: ~

Indian Oil Corp daily chart1. Trend: The stock shows a strong uptrend from August to November, forming higher highs & lows, supported by rising moving averages (blue & red lines).
2. Recent price action: After peaking near ₹174.50, the price entered a consolidation/ correction, breaking below the support zone ₹157.20 and now

IOC 1 Week Time Frame 📊 Current Price (approx):
IOC trading around ₹161–₹163 on NSE/BSE recently.
📈 Weekly Resistance Levels
These are key upside levels where selling pressure may emerge this week:
1. Major Weekly Resistance Zones
R1: ~₹164–₹165
R2: ~₹167–₹168
R3: ~₹172–₹173
Why these matter:
• Above ₹164–₹165, bulls

IOC 1 Month Time Frame 📊 Current Context
IOC is trading around the ₹166–₹168 range as of mid‑December 2025.
Over the last month, the stock has seen a slight decline (~‑2.7% to ‑3.6% depending on source).
🟢 Key 1‑Month Support Levels
These are levels where the price may find buying interest if the stock pulls back:
✅

Indian Oil Corporation Ltd (IOC)Friends, whether you understand price action or not, you can certainly understand that whenever an uptrend begins in a stock, the downtime, or the period of decline, tends to decrease. As I've shown you by marking three points, the last one had the least downtime according to the low count. This mea

IOCL - Investment Doubler - MultiTimeframe Analysis
**📊 Indian Oil Corporation (IOC) - Technical Analysis**
#Multiple timeframe analysis showing IOC at a critical juncture around ₹136-163 levels.
Key Observations:
- On an Yearly Chart, Prev Yearly candle attempt failed to do Breakout.
- On Half-yearly chart breakout confirmed and the stock retrace

IOC 1 Week Time Frame 🔎 Current Snapshot
Latest price on NSE: ~ ₹163.00–₹163.50.
52‑week trading range: ₹110.72 (low) ⇒ ₹174.50 (high).
On moving averages: price is above 50‑day, 100‑day and 200‑day MA — a bullish structural sign, though short‑term oscillators are mixed/neutral.
Recent 1‑week performance: modest g
See all ideas
Summarizing what the indicators are suggesting.
Neutral
SellBuy
Strong sellStrong buy
Strong sellSellNeutralBuyStrong buy
Neutral
SellBuy
Strong sellStrong buy
Strong sellSellNeutralBuyStrong buy
Neutral
SellBuy
Strong sellStrong buy
Strong sellSellNeutralBuyStrong buy
An aggregate view of professional's ratings.
Neutral
SellBuy
Strong sellStrong buy
Strong sellSellNeutralBuyStrong buy
Neutral
SellBuy
Strong sellStrong buy
Strong sellSellNeutralBuyStrong buy
Neutral
SellBuy
Strong sellStrong buy
Strong sellSellNeutralBuyStrong buy
Displays a symbol's price movements over previous years to identify recurring trends.
725IOCL30
Indian Oil Corporation Limited 7.25% 06-JAN-2030Yield to maturity
6.92%
Maturity date
Jan 6, 2030
779IOCL32
Indian Oil Corporation Limited 7.79% 12-APR-2032Yield to maturity
—
Maturity date
Apr 12, 2032
744IOCL27
Indian Oil Corporation Limited 7.44% 25-NOV-2027Yield to maturity
—
Maturity date
Nov 25, 2027
614IOCL27
Indian Oil Corporation Limited 6.14% 18-FEB-2027Yield to maturity
—
Maturity date
Feb 18, 2027
741IOCL29
Indian Oil Corporation Limited 7.41% 22-OCT-2029Yield to maturity
—
Maturity date
Oct 22, 2029
714IOCL27
Indian Oil Corporation Limited 7.14% 06-SEP-2027Yield to maturity
—
Maturity date
Sep 6, 2027
736IOCL29
Indian Oil Corporation Limited 7.36% 16-JUL-2029Yield to maturity
—
Maturity date
Jul 16, 2029
See all IOC bonds
Frequently Asked Questions
The current price of IOC is 177.39 INR — it has increased by 0.37% in the past 24 hours. Watch Indian Oil Corp. Ltd. stock price performance more closely on the chart.
Depending on the exchange, the stock ticker may vary. For instance, on NSE exchange Indian Oil Corp. Ltd. stocks are traded under the ticker IOC.
IOC stock has risen by 4.94% compared to the previous week, the month change is a 13.93% rise, over the last year Indian Oil Corp. Ltd. has showed a 41.91% increase.
We've gathered analysts' opinions on Indian Oil Corp. Ltd. future price: according to them, IOC price has a max estimate of 225.00 INR and a min estimate of 125.00 INR. Watch IOC chart and read a more detailed Indian Oil Corp. Ltd. stock forecast: see what analysts think of Indian Oil Corp. Ltd. and suggest that you do with its stocks.
IOC stock is 1.50% volatile and has beta coefficient of 1.17. Track Indian Oil Corp. Ltd. stock price on the chart and check out the list of the most volatile stocks — is Indian Oil Corp. Ltd. there?
Today Indian Oil Corp. Ltd. has the market capitalization of 2.47 T, it has increased by 6.38% over the last week.
Yes, you can track Indian Oil Corp. Ltd. financials in yearly and quarterly reports right on TradingView.
Indian Oil Corp. Ltd. is going to release the next earnings report on May 19, 2026. Keep track of upcoming events with our Earnings Calendar.
IOC earnings for the last quarter are 9.44 INR per share, whereas the estimation was 7.10 INR resulting in a 32.96% surprise. The estimated earnings for the next quarter are 4.63 INR per share. See more details about Indian Oil Corp. Ltd. earnings.
Indian Oil Corp. Ltd. revenue for the last quarter amounts to 2.37 T INR, despite the estimated figure of 1.92 T INR. In the next quarter, revenue is expected to reach 2.10 T INR.
IOC net income for the last quarter is 130.07 B INR, while the quarter before that showed 78.18 B INR of net income which accounts for 66.38% change. Track more Indian Oil Corp. Ltd. financial stats to get the full picture.
Indian Oil Corp. Ltd. dividend yield was 2.35% in 2024, and payout ratio reached 30.38%. The year before the numbers were 7.15% and 39.60% correspondingly. See high-dividend stocks and find more opportunities for your portfolio.
As of Feb 10, 2026, the company has 29.94 K employees. See our rating of the largest employees — is Indian Oil Corp. Ltd. on this list?
EBITDA measures a company's operating performance, its growth signifies an improvement in the efficiency of a company. Indian Oil Corp. Ltd. EBITDA is 679.25 B INR, and current EBITDA margin is 5.11%. See more stats in Indian Oil Corp. Ltd. financial statements.
Like other stocks, IOC shares are traded on stock exchanges, e.g. Nasdaq, Nyse, Euronext, and the easiest way to buy them is through an online stock broker. To do this, you need to open an account and follow a broker's procedures, then start trading. You can trade Indian Oil Corp. Ltd. stock right from TradingView charts — choose your broker and connect to your account.
Investing in stocks requires a comprehensive research: you should carefully study all the available data, e.g. company's financials, related news, and its technical analysis. So Indian Oil Corp. Ltd. technincal analysis shows the buy rating today, and its 1 week rating is strong buy. Since market conditions are prone to changes, it's worth looking a bit further into the future — according to the 1 month rating Indian Oil Corp. Ltd. stock shows the strong buy signal. See more of Indian Oil Corp. Ltd. technicals for a more comprehensive analysis.
If you're still not sure, try looking for inspiration in our curated watchlists.
If you're still not sure, try looking for inspiration in our curated watchlists.