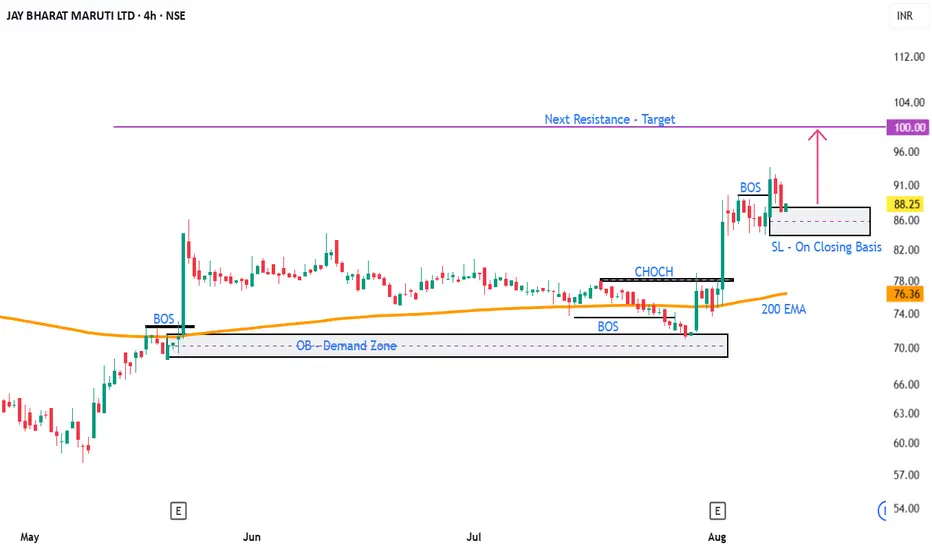
Buy for the target of 99.50/100Technical Analysis (SMC Method) :
=> Uptrend - The price is trading in above 200 EMA
=> Demand Zone (OB) formed with impulse move & BOS
=? Demand Zone mitigation done properly
=? After mitigation, the character was changed to move further
upside, which is confirmed by forming again BOS
=> Targ
4.69 INR
329.13 M INR
22.90 B INR
19.72 M
About Jay Bharat Maruti Limited
Sector
Industry
CEO
Surendra Kumar Arya
Website
Headquarters
Gurgaon
Founded
1987
ISIN
INE571B01036
FIGI
BBG000CTQ5Q4
Jay Bharat Maruti Ltd. engages in manufacture of components for automobiles. Its product portfolio includes sheet metal components, welded assemblies, chassis and suspension parts and assemblies, exhaust systems, fuel fillers, rear axle, tubes and tubular parts, jigs and fixtures, and metal forming components. The company was founded on March 19, 1987 and is headquartered in Gurgaon, India.
Related stocks
JaybarmaruCurrently at the demand zone. Should take support here unless market crashes. The targets are marked as T1 and T2.

JAYBARMARU - Weekly Chart Analysis, CMP-135.20After coming out of the probable low cheat zone 95-103, it went straight to the resistance / supply zone 126-149.
It consolidated there in the zone for almost 28 weeks in 27% range and finally showing strength breaking this base and sustaining there for the 2nd week and that too on good volumes.

Jay Bharat Maruti #Monthly Chart StudyJay Bharat Maruti #Monthly Chart Study
Price is in continuous up trend and moving in a upward channel as shown
It needs to break out of strong supply zone between 130-149 after 7 years with good volume for up-ward journey
This can be added on dips till 94 with SL 79.5 on Weekly closing basis
For


📈 Exciting Bullish Pattern Alert! 🐂📈 Exciting Bullish Pattern Alert! 🐂
📊 Pattern: Falling Wedge breakout & Flag & Pole
📌 Symbol/Asset: JAYBARMARU
🔍 Description: Stock has given breakout of falling Wedge and now making Flag & Pole pattern
👉 Disclosure: We are not SEBI registered analysts, this is not a buy or sell recommendation.

BUY JAY BHARAT MARUTI CALLbuy call@ 190 tgt-220\250\300
sl-170
buy call@ 190 tgt-220\250\300
sl-170
buy call@ 190 tgt-220\250\300
sl-170

JAY BHARAT MARUTI Pullback Trade1. Buy or Sell at your own risk
2. Don't risk more than 1%-2% of your capital as stop loss
3. Position Size formula: - Stop Loss Amount/(Buy Price - Initial Stop Loss Price)
4. Sell on initial Stop Loss hit or RSI close below 40
5. Some other ways to sell stocks can be
a. 25% or 50% up in three week

Jay Bharat Maruti: Falling trendline breakoutJay Bharat Maruti is trying to breakout falling trendline. Keep on radar for closing above 190. Entire Auto including auto ancillary sector is doing well.

Jay Bharat Maruti Ltd: Bullish Breakout ReadyNSE:JAYBARMARU is showing a bullish breakout with the following traits:
A perfect Cup&Handle Patten breakout above 200.
Prior to that an inverted H&S pattern is created.
Buy at 200 with a SL of 194/195.

See all ideas
Summarizing what the indicators are suggesting.
Oscillators
Neutral
SellBuy
Strong sellStrong buy
Strong sellSellNeutralBuyStrong buy
Oscillators
Neutral
SellBuy
Strong sellStrong buy
Strong sellSellNeutralBuyStrong buy
Summary
Neutral
SellBuy
Strong sellStrong buy
Strong sellSellNeutralBuyStrong buy
Summary
Neutral
SellBuy
Strong sellStrong buy
Strong sellSellNeutralBuyStrong buy
Summary
Neutral
SellBuy
Strong sellStrong buy
Strong sellSellNeutralBuyStrong buy
Moving Averages
Neutral
SellBuy
Strong sellStrong buy
Strong sellSellNeutralBuyStrong buy
Moving Averages
Neutral
SellBuy
Strong sellStrong buy
Strong sellSellNeutralBuyStrong buy
Displays a symbol's price movements over previous years to identify recurring trends.
Frequently Asked Questions
The current price of JAYBARMARU is 98.42 INR — it has decreased by −1.90% in the past 24 hours. Watch Jay Bharat Maruti Limited stock price performance more closely on the chart.
Depending on the exchange, the stock ticker may vary. For instance, on NSE exchange Jay Bharat Maruti Limited stocks are traded under the ticker JAYBARMARU.
JAYBARMARU stock has fallen by −8.96% compared to the previous week, the month change is a 4.70% rise, over the last year Jay Bharat Maruti Limited has showed a −2.51% decrease.
JAYBARMARU reached its all-time high on Jul 17, 2017 with the price of 149.40 INR, and its all-time low was 0.70 INR and was reached on May 24, 2001. View more price dynamics on JAYBARMARU chart.
See other stocks reaching their highest and lowest prices.
See other stocks reaching their highest and lowest prices.
JAYBARMARU stock is 8.12% volatile and has beta coefficient of 0.91. Track Jay Bharat Maruti Limited stock price on the chart and check out the list of the most volatile stocks — is Jay Bharat Maruti Limited there?
Today Jay Bharat Maruti Limited has the market capitalization of 10.82 B, it has decreased by −5.11% over the last week.
Yes, you can track Jay Bharat Maruti Limited financials in yearly and quarterly reports right on TradingView.
JAYBARMARU net income for the last quarter is 232.88 M INR, while the quarter before that showed 205.62 M INR of net income which accounts for 13.26% change. Track more Jay Bharat Maruti Limited financial stats to get the full picture.
Yes, JAYBARMARU dividends are paid annually. The last dividend per share was 0.70 INR. As of today, Dividend Yield (TTM)% is 0.70%. Tracking Jay Bharat Maruti Limited dividends might help you take more informed decisions.
Jay Bharat Maruti Limited dividend yield was 1.24% in 2024, and payout ratio reached 23.02%. The year before the numbers were 0.59% and 23.52% correspondingly. See high-dividend stocks and find more opportunities for your portfolio.
As of Oct 10, 2025, the company has 4.32 K employees. See our rating of the largest employees — is Jay Bharat Maruti Limited on this list?
EBITDA measures a company's operating performance, its growth signifies an improvement in the efficiency of a company. Jay Bharat Maruti Limited EBITDA is 1.93 B INR, and current EBITDA margin is 7.23%. See more stats in Jay Bharat Maruti Limited financial statements.
Like other stocks, JAYBARMARU shares are traded on stock exchanges, e.g. Nasdaq, Nyse, Euronext, and the easiest way to buy them is through an online stock broker. To do this, you need to open an account and follow a broker's procedures, then start trading. You can trade Jay Bharat Maruti Limited stock right from TradingView charts — choose your broker and connect to your account.
Investing in stocks requires a comprehensive research: you should carefully study all the available data, e.g. company's financials, related news, and its technical analysis. So Jay Bharat Maruti Limited technincal analysis shows the neutral today, and its 1 week rating is buy. Since market conditions are prone to changes, it's worth looking a bit further into the future — according to the 1 month rating Jay Bharat Maruti Limited stock shows the buy signal. See more of Jay Bharat Maruti Limited technicals for a more comprehensive analysis.
If you're still not sure, try looking for inspiration in our curated watchlists.
If you're still not sure, try looking for inspiration in our curated watchlists.