Kalyan Jewellers Bullish SetupKalyan Jewellers
F&O Segment Stock
The stock fell almost 50% from its high of about ₹783 in September 2024. But now it's finding good support, building a base, and moving inside a parallel channel. For the past year, it's been stuck in a range—which usually means a bigger move is getting ready (cou
Next report date
—
Report period
—
EPS estimate
—
Revenue estimate
—
9.00 INR
7.15 B INR
250.45 B INR
359.86 M
About Kalyan Jewellers India Ltd.
Sector
Industry
CEO
Sanjay Raghuraman
Website
Headquarters
Thrissur
Founded
1993
Identifiers
2
ISININE303R01014
Kalyan Jewellers India Ltd. owns and operates jewellery stores. The firm offers gold, diamond, platinum, and silver jewelleries. Its brands include Mudhra, Nimah, Anokhi, Rang, Tejasvi, Ziah, Laya, Glo, Candere, Vedha, Apoorva, and Hera. The company was founded by TS Kalyanaraman in 1993 and is headquartered in Thrissur, India.
Related stocks

KALYANKJIL 1 Week Time Frame 📉 1‑Week Price Movement & Technical Snapshot
The share price has fallen by ~4–5% over the last week.
Current quote (around 9–10 Dec 2025) is in the ₹468–473 range.
From its 52‑week high of ₹794.60, the stock is down more than 40%.
Technical‑analysis commentary suggests “bearish momentum” and

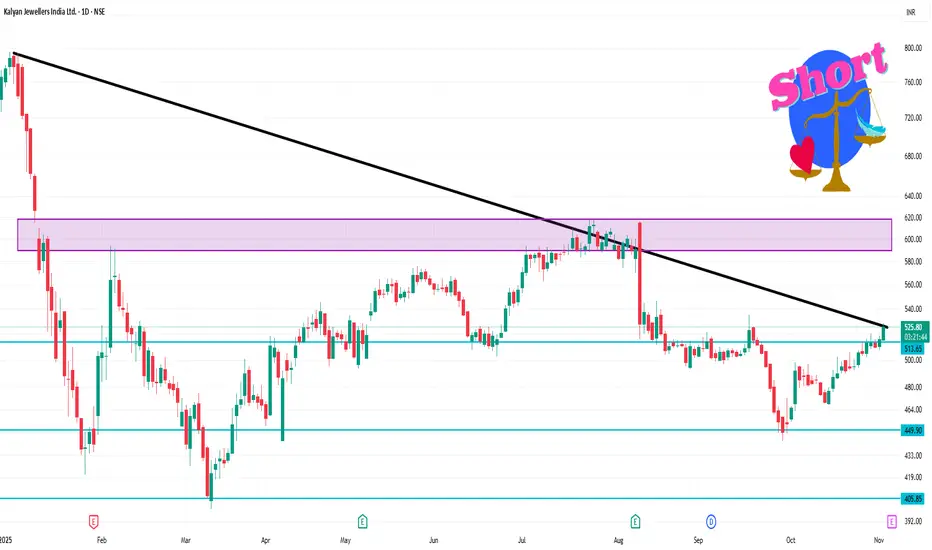
Kalyan Jewellers: Wave Y Still at Play?Disclaimer: This analysis is for educational purposes only and does not constitute investment advice. Please do your own research (DYOR) before making any trading decisions.
Bigger Picture
Kalyan Jewellers topped near 795.40 and has been in a prolonged corrective phase. The structure since then

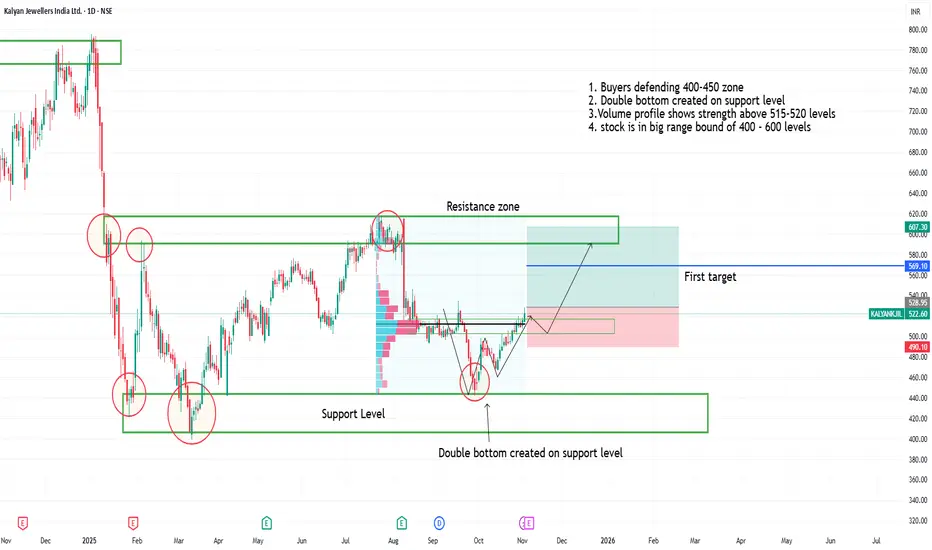
Double bottom in kalyan jwellers on support level1. Buyers defending 400-450 zone
2. Double bottom created on support level
3.Volume profile shows strength above 515-520 levels
4. stock is in big range bound of 400 - 600 levels
5. One can watch for upside movement
KALYANKJIL 1 Day Time frame✅ Important Levels
Pivot Point (daily): ~ ₹ 514.
Resistance Levels:
R1 ≈ ₹ 519
R2 ≈ ₹ 526
R3 ≈ ₹ 531 and above
Support Levels:
S1 ≈ ₹ 507
S2 ≈ ₹ 502
S3 ≈ ₹ 495 (or slightly below)
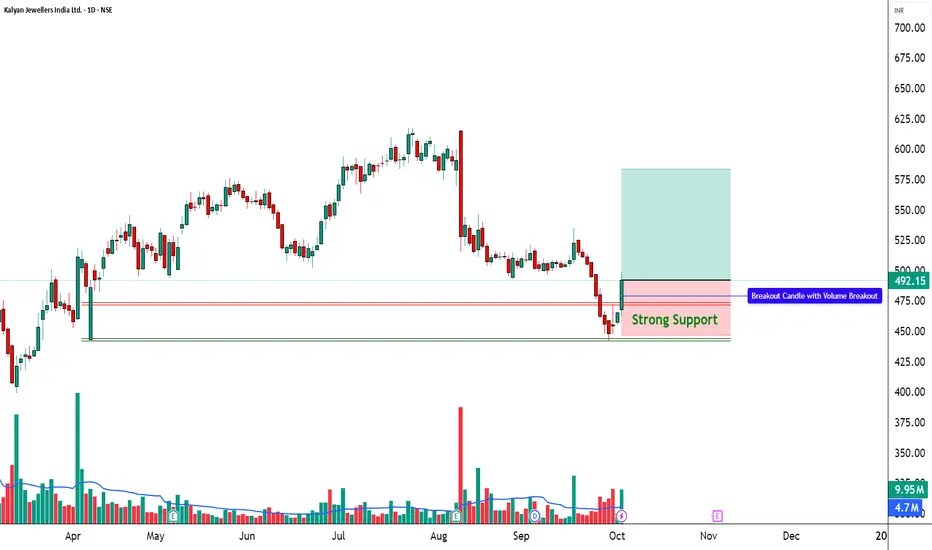
Kalyan Jewellers | RSI Breakout + High Volume Alert________________________________________
📈 Kalyan Jewellers | RSI Breakout + High Volume Alert 🚨
🔹 Entry Zone: ₹492.15
🔹 Stop Loss: ₹446.55 (Risk ~45.60 pts)
🔹 Supports: 470.48 / 448.82 / 434.93
🔹 Resistances: 506.03 / 519.92 / 541.58
________________________________________
🔑 Key Highlights
✅ Stron
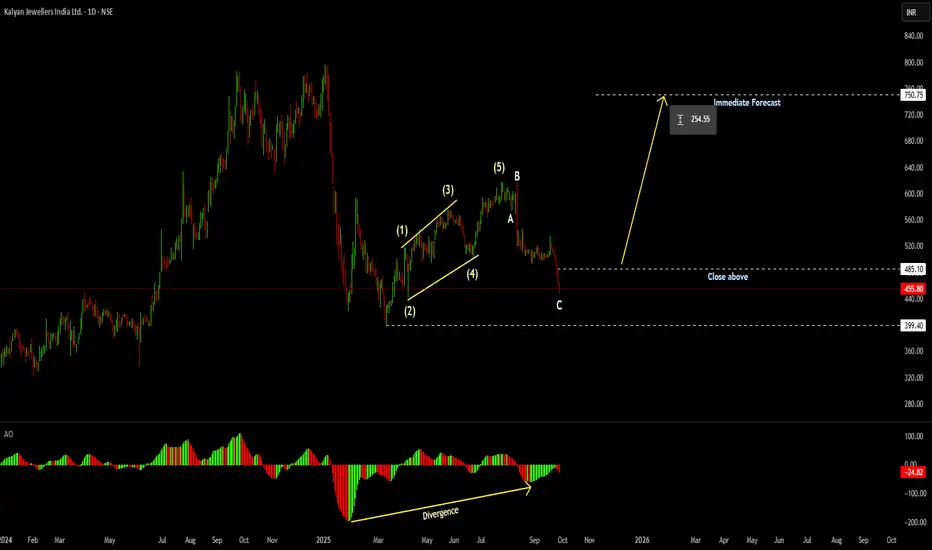
Ideal Wave Pattern In the Market when chaos take place due to News or Geo Politics , Few stocks Quietly make their move before anyone Could understand what happened
Same is true with This stock , it has made its 1st Impulse Wave ( Preferred) and entered
in deep price correction in counter move suggesting three stro
Kalyan Jewelry: Technical Analysis and Investment OutlookFormation of Bat Pattern: Kalyan Jewelry has recently formed a Bat pattern, a bullish reversal pattern that suggests potential price increases in the near future.
Strong Support Level: The stock is currently trading at a significant support level around ₹525, which may provide a solid foundation for

Kalyan Jewellers – Change of Character + Order Block Reversal💎 Kalyan Jewellers – Change of Character + Order Block Reversal 🚀
Chart Pattern (1H):
Price has formed a rounded bottom with a clear Change of Character (CHOCH), shifting momentum from bearish to bullish.
A supposed bullish order block around ₹505–510 is acting as a strong demand zone.
RSI

Kalyankjil (Kalyan jeweller)Kalyan Jewellers has demonstrated substantial support over the past four months, both on a weekly and monthly basis. The focus is on capitalizing on this trend, driven by Kalyan's strong financial performance, including impressive year-over-year sales growth. Major investors are actively participati

See all ideas
Summarizing what the indicators are suggesting.
Neutral
SellBuy
Strong sellStrong buy
Strong sellSellNeutralBuyStrong buy
Neutral
SellBuy
Strong sellStrong buy
Strong sellSellNeutralBuyStrong buy
Neutral
SellBuy
Strong sellStrong buy
Strong sellSellNeutralBuyStrong buy
An aggregate view of professional's ratings.
Neutral
SellBuy
Strong sellStrong buy
Strong sellSellNeutralBuyStrong buy
Neutral
SellBuy
Strong sellStrong buy
Strong sellSellNeutralBuyStrong buy
Neutral
SellBuy
Strong sellStrong buy
Strong sellSellNeutralBuyStrong buy
Displays a symbol's price movements over previous years to identify recurring trends.
Frequently Asked Questions
The current price of KALYANKJIL is 488.35 INR — it has increased by 0.63% in the past 24 hours. Watch Kalyan Jewellers India Ltd. stock price performance more closely on the chart.
Depending on the exchange, the stock ticker may vary. For instance, on NSE exchange Kalyan Jewellers India Ltd. stocks are traded under the ticker KALYANKJIL.
KALYANKJIL stock has risen by 1.84% compared to the previous week, the month change is a −3.12% fall, over the last year Kalyan Jewellers India Ltd. has showed a −32.89% decrease.
We've gathered analysts' opinions on Kalyan Jewellers India Ltd. future price: according to them, KALYANKJIL price has a max estimate of 775.00 INR and a min estimate of 500.00 INR. Watch KALYANKJIL chart and read a more detailed Kalyan Jewellers India Ltd. stock forecast: see what analysts think of Kalyan Jewellers India Ltd. and suggest that you do with its stocks.
KALYANKJIL reached its all-time high on Jan 2, 2025 with the price of 795.40 INR, and its all-time low was 55.05 INR and was reached on Jun 20, 2022. View more price dynamics on KALYANKJIL chart.
See other stocks reaching their highest and lowest prices.
See other stocks reaching their highest and lowest prices.
KALYANKJIL stock is 1.92% volatile and has beta coefficient of 1.86. Track Kalyan Jewellers India Ltd. stock price on the chart and check out the list of the most volatile stocks — is Kalyan Jewellers India Ltd. there?
Today Kalyan Jewellers India Ltd. has the market capitalization of 501.20 B, it has decreased by −1.91% over the last week.
Yes, you can track Kalyan Jewellers India Ltd. financials in yearly and quarterly reports right on TradingView.
Kalyan Jewellers India Ltd. is going to release the next earnings report on Jan 29, 2026. Keep track of upcoming events with our Earnings Calendar.
Kalyan Jewellers India Ltd. revenue for the last quarter amounts to 78.56 B INR, despite the estimated figure of 78.43 B INR. In the next quarter, revenue is expected to reach 98.66 B INR.
KALYANKJIL net income for the last quarter is 2.61 B INR, while the quarter before that showed 2.64 B INR of net income which accounts for −1.35% change. Track more Kalyan Jewellers India Ltd. financial stats to get the full picture.
Yes, KALYANKJIL dividends are paid annually. The last dividend per share was 1.50 INR. As of today, Dividend Yield (TTM)% is 0.31%. Tracking Kalyan Jewellers India Ltd. dividends might help you take more informed decisions.
Kalyan Jewellers India Ltd. dividend yield was 0.32% in 2024, and payout ratio reached 21.64%. The year before the numbers were 0.28% and 20.69% correspondingly. See high-dividend stocks and find more opportunities for your portfolio.
As of Dec 24, 2025, the company has 12.53 K employees. See our rating of the largest employees — is Kalyan Jewellers India Ltd. on this list?
EBITDA measures a company's operating performance, its growth signifies an improvement in the efficiency of a company. Kalyan Jewellers India Ltd. EBITDA is 18.43 B INR, and current EBITDA margin is 6.51%. See more stats in Kalyan Jewellers India Ltd. financial statements.
Like other stocks, KALYANKJIL shares are traded on stock exchanges, e.g. Nasdaq, Nyse, Euronext, and the easiest way to buy them is through an online stock broker. To do this, you need to open an account and follow a broker's procedures, then start trading. You can trade Kalyan Jewellers India Ltd. stock right from TradingView charts — choose your broker and connect to your account.
Investing in stocks requires a comprehensive research: you should carefully study all the available data, e.g. company's financials, related news, and its technical analysis. So Kalyan Jewellers India Ltd. technincal analysis shows the neutral today, and its 1 week rating is sell. Since market conditions are prone to changes, it's worth looking a bit further into the future — according to the 1 month rating Kalyan Jewellers India Ltd. stock shows the neutral signal. See more of Kalyan Jewellers India Ltd. technicals for a more comprehensive analysis.
If you're still not sure, try looking for inspiration in our curated watchlists.
If you're still not sure, try looking for inspiration in our curated watchlists.