Lloyds Metals & Energy LtdDate 03.01.2026
Lloyds Metals & Energy Ltd
Timeframe : Weekly Chart
About
(1) In business of manufacturing of Sponge Iron, Power generation and mining activities
(2) It is one of the largest iron ore merchant miner in India
(3) Company is pioneer in integrated sponge iron production, with a cap
Lloyds Metals & Energy Ltd.
No trades
Next report date
—
Report period
—
EPS estimate
—
Revenue estimate
—
46.85 INR
14.50 B INR
66.48 B INR
97.42 M
About Lloyds Metals & Energy Ltd.
Sector
Industry
Website
Headquarters
Mumbai
Founded
1977
IPO date
Feb 21, 1995
Identifiers
2
ISIN INE281B01032
Lloyds Metals & Energy Ltd. engages in the manufacturing, generation, and distribution of iron, steel, and power. It operates through the following segments: Sponge Iron, Power, and Mining. The Sponge Iron segment includes production and manufacturing of sponge iron. The Power segment refers to the extraction of iron ore from mines. The Mining segment focuses on the generation of power. The company was founded by Babulal Kesardeo Agarwal and Rajesh Rajnarayan Gupta on April 5, 1977 and is headquartered in Mumbai, India.
Related stocks

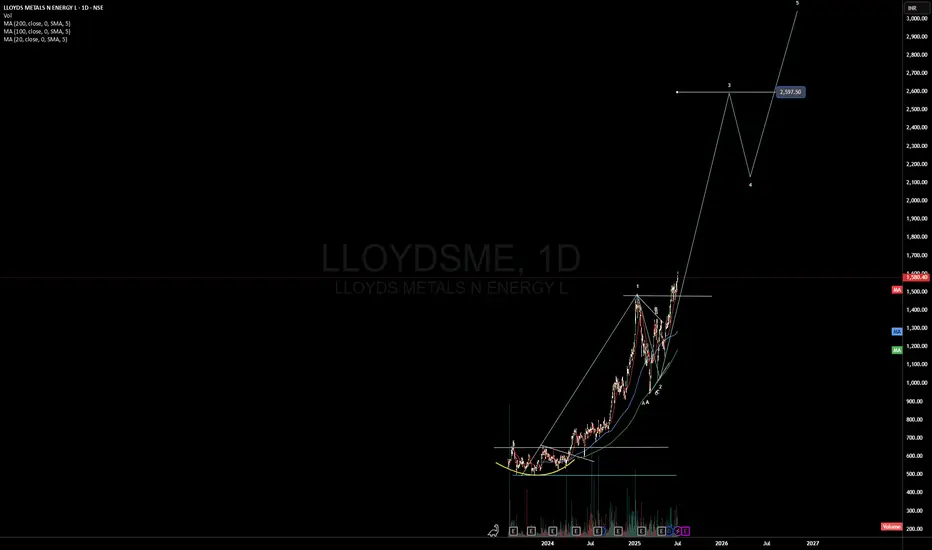
Lloyds Metals Hints at Final Wave V RallyThe wave principle suggests Lloyds Metals has likely completed Wave IV, with an upward Wave V move potentially unfolding toward new highs.

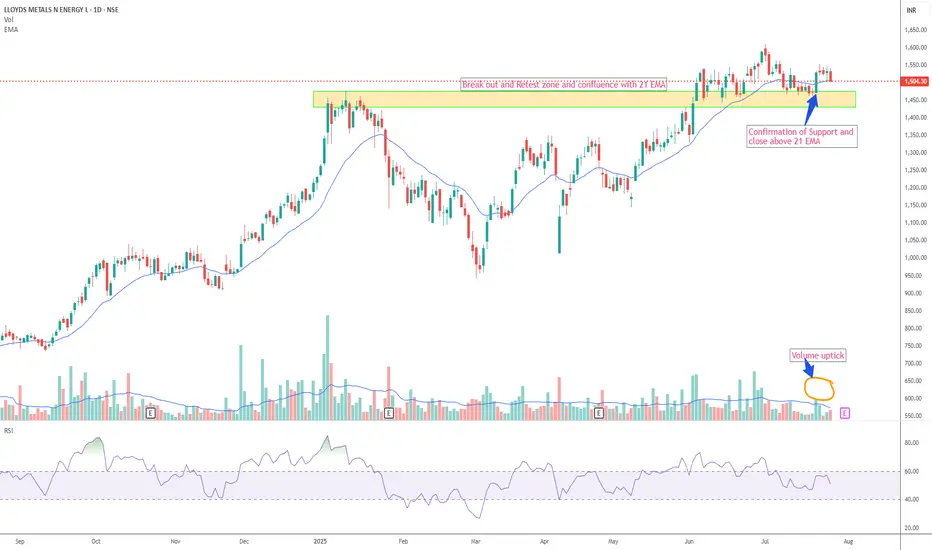
LLOYDSME LLOYDSME is looking good.
It has re-tested the BO and now bouncing from the support zone, above 20ema
✅ If you like my analysis, please follow me as a token of appreciation :)
in.tradingview.com/u/SatpalS/
📌 For learning and educational purposes only, not a recommendation. Please consult your

LLOYDSME – Breakout Retest with 21 EMA ConfluenceAs part of my personal trading strategy, I am closely watching LLOYDSME, which is currently retesting a recent breakout zone and hovering near a key support level. This area also coincides with the 21 EMA on the daily chart, adding to the technical confluence.
I am considering a long position if th
Wave 3 in Progress- Should double from hereDetails and targets marked in the chart:
Currently its in Wave 3 after wave 2 that corrected to around 100, currently broken out of the wave 1 highs and is moving up.
Wave 3 is normally steep than other waves and even extends too. Ideally a best place to be to enjoy the ride.
This stock started o
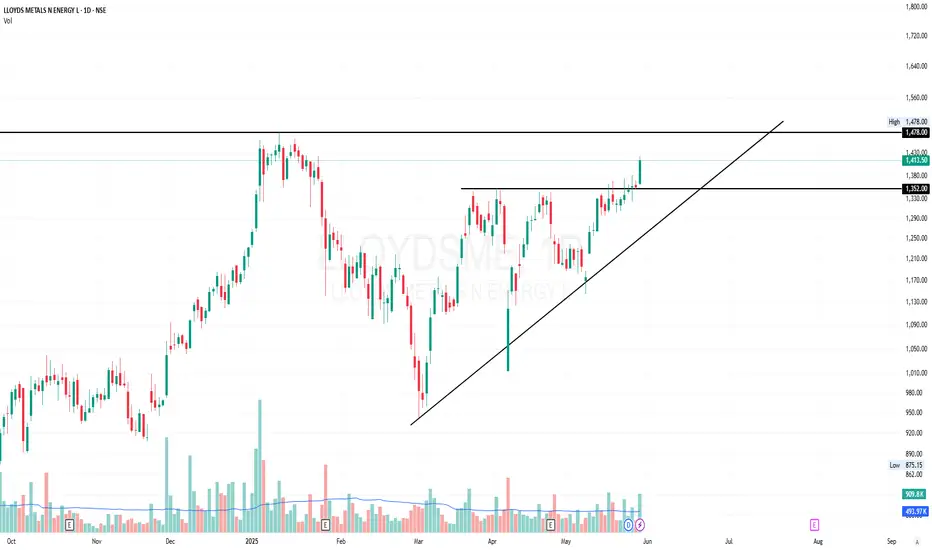
LLOYDSME - VCP BreakoutLLOYDSME
1) Time Frame - Daily.
2) A Volatility Contraction Pattern Breakout after a good consolidation.
3) The stock may find it's next resistance at the price 1478 (All Time High) & Move further if the momentum kicks in.
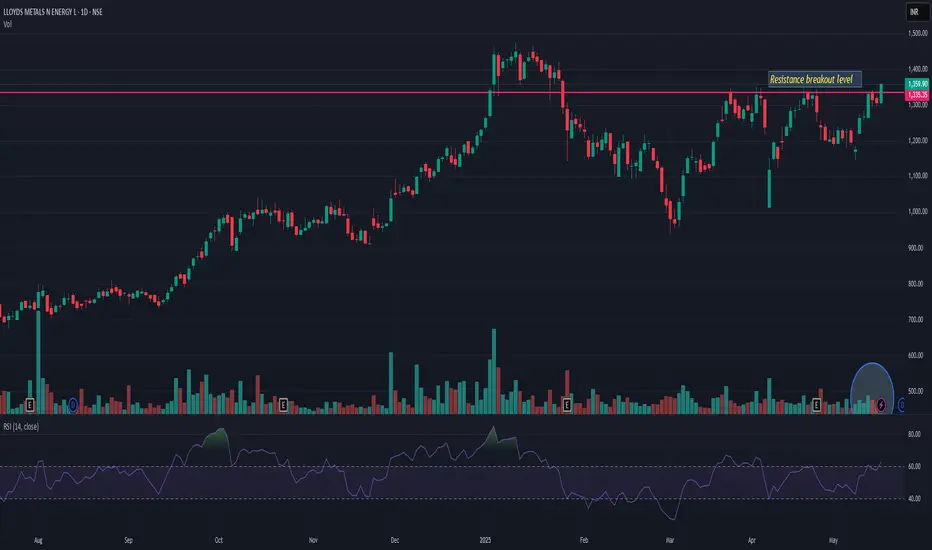
Breakout in Lloyds Metals Lloyds Metals & Energy is into the business of manufacturing of Sponge Iron, Power generation and mining activities
Breakout Screener:
VCP (Volatility Contraction Pattern) Breakout Setup
-The Relative Strength Index (RSI) is approaching 70 and trending upwards, indicating strengthening momentum an

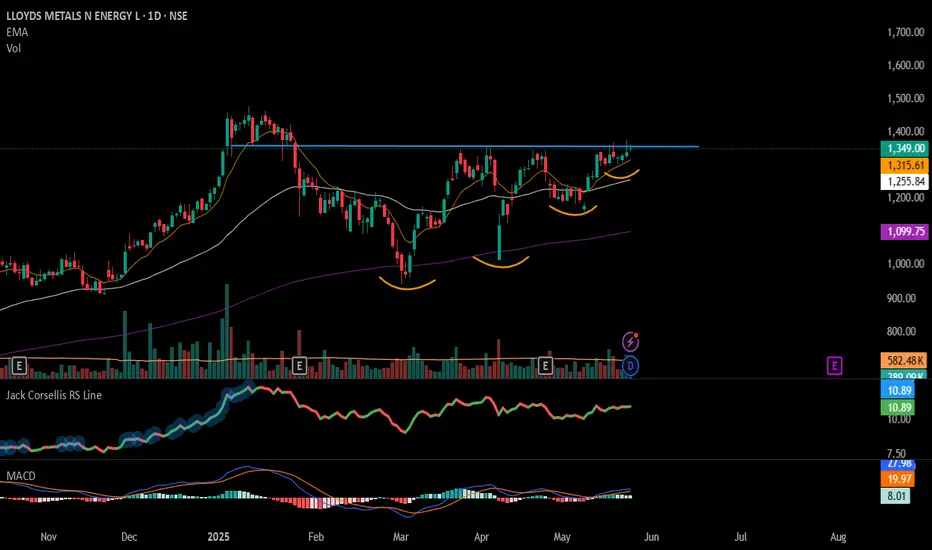
#LLOYDSME - BreakOut Soon Candidate📊 Script: LLOYDSME
Key highlights: 💡⚡
📈 VCP BreakOut in Daily Time Frame.
📈 Price consolidating near Resistance.
📈 Wait for Volume spike during Breakout
📈 MACD Bullish
📈 Can go for a swing trade
BUY ONLY ABOVE 1405 DCB
⏱️ C.M.P 📑💰- 1349
🟢 Target 🎯🏆 – NA%
⚠️ Stoploss ☠️🚫 – NA%
⚠️ Important: Mar
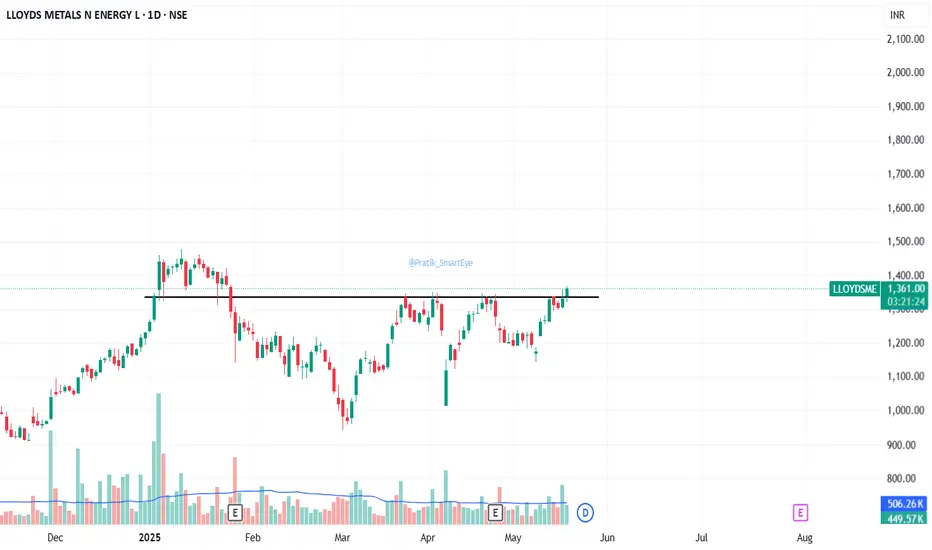
Lloyds Metals: at Breakout Levels.Lloyds Metals: at Breakout closing above 1336. CMP 1360.
Resistance at 1450.
LLOYDSMELLOYDSME showing v good strength and seems like if it sustains above 1355 then it may start a new rally from here. Showing a very strong momentum on daily as well as weekly. 1260 is strong support. So closing below it may change my view.
See all ideas
Summarizing what the indicators are suggesting.
Neutral
SellBuy
Strong sellStrong buy
Strong sellSellNeutralBuyStrong buy
Neutral
SellBuy
Strong sellStrong buy
Strong sellSellNeutralBuyStrong buy
Neutral
SellBuy
Strong sellStrong buy
Strong sellSellNeutralBuyStrong buy
An aggregate view of professional's ratings.
Neutral
SellBuy
Strong sellStrong buy
Strong sellSellNeutralBuyStrong buy
Neutral
SellBuy
Strong sellStrong buy
Strong sellSellNeutralBuyStrong buy
Neutral
SellBuy
Strong sellStrong buy
Strong sellSellNeutralBuyStrong buy
Displays a symbol's price movements over previous years to identify recurring trends.
MIDCAPETF
Mirae Asset Nifty Midcap 150 ETF Exchange Traded Fund UnitsWeight
0.38%
Market value
583.92 K
USD
Explore more ETFs
Frequently Asked Questions
The current price of LLOYDSME is 1,190.40 INR — it has decreased by −2.87% in the past 24 hours. Watch Lloyds Metals & Energy Ltd. stock price performance more closely on the chart.
Depending on the exchange, the stock ticker may vary. For instance, on NSE exchange Lloyds Metals & Energy Ltd. stocks are traded under the ticker LLOYDSME.
LLOYDSME stock has fallen by −5.52% compared to the previous week, the month change is a −3.30% fall, over the last year Lloyds Metals & Energy Ltd. has showed a 0.79% increase.
We've gathered analysts' opinions on Lloyds Metals & Energy Ltd. future price: according to them, LLOYDSME price has a max estimate of 2,100.00 INR and a min estimate of 1,540.00 INR. Watch LLOYDSME chart and read a more detailed Lloyds Metals & Energy Ltd. stock forecast: see what analysts think of Lloyds Metals & Energy Ltd. and suggest that you do with its stocks.
LLOYDSME reached its all-time high on Jul 1, 2025 with the price of 1,612.00 INR, and its all-time low was 492.00 INR and was reached on Nov 6, 2023. View more price dynamics on LLOYDSME chart.
See other stocks reaching their highest and lowest prices.
See other stocks reaching their highest and lowest prices.
LLOYDSME stock is 3.77% volatile and has beta coefficient of 2.33. Track Lloyds Metals & Energy Ltd. stock price on the chart and check out the list of the most volatile stocks — is Lloyds Metals & Energy Ltd. there?
Today Lloyds Metals & Energy Ltd. has the market capitalization of 629.74 B, it has increased by 7.76% over the last week.
Yes, you can track Lloyds Metals & Energy Ltd. financials in yearly and quarterly reports right on TradingView.
Lloyds Metals & Energy Ltd. is going to release the next earnings report on Apr 24, 2026. Keep track of upcoming events with our Earnings Calendar.
LLOYDSME net income for the last quarter is 10.47 B INR, while the quarter before that showed 5.72 B INR of net income which accounts for 82.99% change. Track more Lloyds Metals & Energy Ltd. financial stats to get the full picture.
Yes, LLOYDSME dividends are paid annually. The last dividend per share was 1.00 INR. As of today, Dividend Yield (TTM)% is 0.08%. Tracking Lloyds Metals & Energy Ltd. dividends might help you take more informed decisions.
Lloyds Metals & Energy Ltd. dividend yield was 0.08% in 2024, and payout ratio reached 3.57%. The year before the numbers were 0.17% and 4.06% correspondingly. See high-dividend stocks and find more opportunities for your portfolio.
As of Feb 15, 2026, the company has 2.37 K employees. See our rating of the largest employees — is Lloyds Metals & Energy Ltd. on this list?
EBITDA measures a company's operating performance, its growth signifies an improvement in the efficiency of a company. Lloyds Metals & Energy Ltd. EBITDA is 38.58 B INR, and current EBITDA margin is 29.34%. See more stats in Lloyds Metals & Energy Ltd. financial statements.
Like other stocks, LLOYDSME shares are traded on stock exchanges, e.g. Nasdaq, Nyse, Euronext, and the easiest way to buy them is through an online stock broker. To do this, you need to open an account and follow a broker's procedures, then start trading. You can trade Lloyds Metals & Energy Ltd. stock right from TradingView charts — choose your broker and connect to your account.
Investing in stocks requires a comprehensive research: you should carefully study all the available data, e.g. company's financials, related news, and its technical analysis. So Lloyds Metals & Energy Ltd. technincal analysis shows the sell today, and its 1 week rating is sell. Since market conditions are prone to changes, it's worth looking a bit further into the future — according to the 1 month rating Lloyds Metals & Energy Ltd. stock shows the buy signal. See more of Lloyds Metals & Energy Ltd. technicals for a more comprehensive analysis.
If you're still not sure, try looking for inspiration in our curated watchlists.
If you're still not sure, try looking for inspiration in our curated watchlists.