LTTS : Near Key Support | Trend Continuation WatchTimeframe: Daily
Trend Context: Corrective phase nearing completion
Current Price Zone: ~4,380
🔍 Market Structure & Technical Observations
Elliott Wave Perspective (Educational View):
The stock appears to be completing a corrective Wave-C near the 4,360–4,390 zone.
This zone aligns with prior de
L&T Technology Services Ltd.
No trades
Next report date
—
Report period
—
EPS estimate
—
Revenue estimate
—
118.75 INR
12.67 B INR
106.70 B INR
27.61 M
About L&T Technology Services Ltd.
Sector
CEO
Amit Chadha
Website
Headquarters
Vadodara
Founded
2013
IPO date
Sep 23, 2016
Identifiers
2
ISIN INE010V01017
L&T Technology Services Ltd. engages in engineering and technology consulting services. It offers design. Development, and sustenance services across products and processes. It operates through the following segments: Mobility, Sustainability, and Tech. The Mobility segment refers to automotive, aerospace engineering, rail transportation, and trucks and off-highway vehicles. The Sustainability segment involves discrete manufacturing and industrial products. The Tech segment pertains to public infrastructure and smart cities, software, and platforms. The company was founded by Anil Kumar Manibhai Naik on June 14, 2012 and is headquartered in Vadodara, India.
Related stocks

#LTTS READY FOR BIG GAIN #LTTS Ready For BIG Gain Now4400
Strong Rversal ON IT SECTOR
All Services will perform well ready for 5/6k
max 30 % in #LONG term

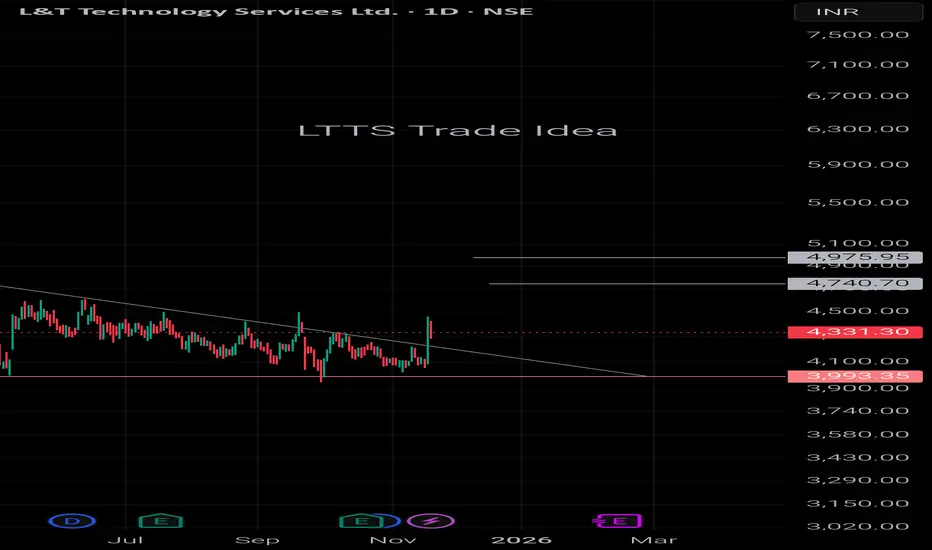
LTTS Deacending Triangle LTTS is giving a breakout from a Descending Triangle Pattern and the immediate Targets for the stock are 4740 and 4975 From FIB Retracement. Sometimes Inaction Hurts more than the not having the right trade 🥲
L&T Technology Services: Correction Complete Near Golden Ratio?After a textbook five-wave impulse from ₹2,924 (2022 low) to ₹6,000 (2024 high), L&T Technology Services appears to have completed a proportional A–B–C correction, finding support precisely near the 0.618 retracement (₹4,099) of the entire advance.
Wave Structure
The advance from the 2022 low

LLTS: Bullish View Intact - ATH BO soon!1. Setup looking good for a minimum 15% upside.
2. Price structure is bullish.
3. RRR looks favourable.
4. Last time the entry was late, due to that SL was hit by a whipsaw. this time entry is better.
⚠️ Disclaimer: This is NOT a buy/sell recommendation. This post is meant for learning purposes onl

buy the dip! LTTS ready for long term gainsbuy above 4300 looks good
hoping it will double in 5 years, giving enough sl for volatility to play out
Are willing to hold medium‑term (3‑5 years) and believe in growth of digital engineering / R&D globally.
Can tolerate some volatility and margin compression in the short term in exchange for lo

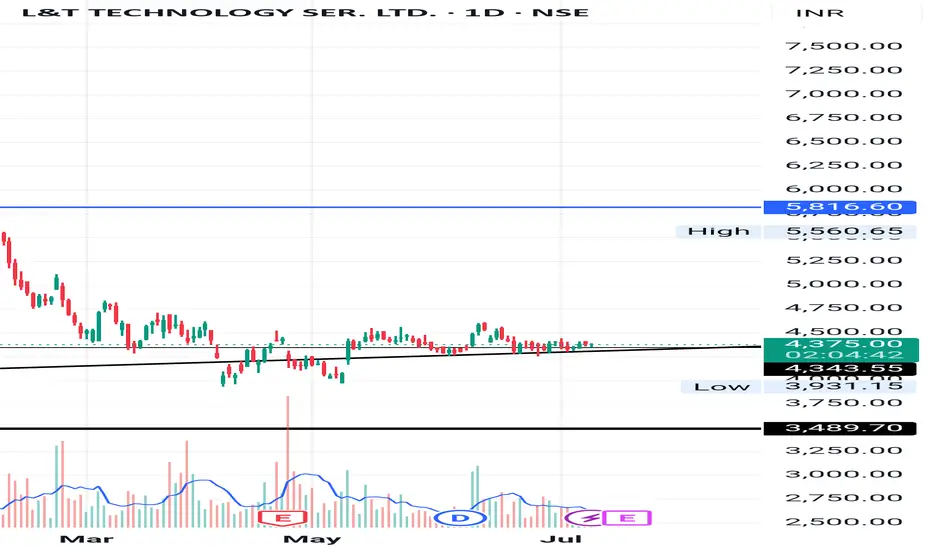
A good buy in the IT spaceLTTS Technical Analysis (CMP: 4392)
Fibonacci Analysis: The stock's halt at the 50% retracement level of the rally indicates strength. A key reversal at the Fibonacci confluence zone (3920) further confirms the support.
Trendline Support: The trendline support coinciding with the Fibonacci zone ad

LTTS movement LTTS is consolidating. And its near to 2 resistance which is breaking point. There are chances that, it might create sudden up movement. You can keep it in watchlist
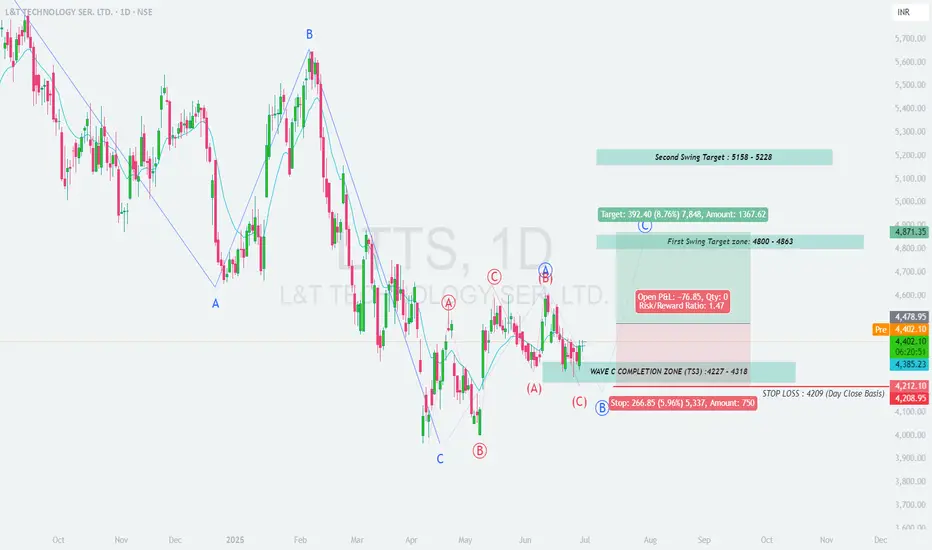
LTTS : Completing Wave B or Starting Corrective Wave 5?
## 📊 **LTTS Daily Chart Analysis**
### 🧩 **Price Structure Overview**
* The chart shows a completed **ABC correction** pattern.
* Price has recently bounced from a key \ support demand zone\ , marked by the blue and yellow boxes.
* A bullish wave structure is potentially forming, indicating trend
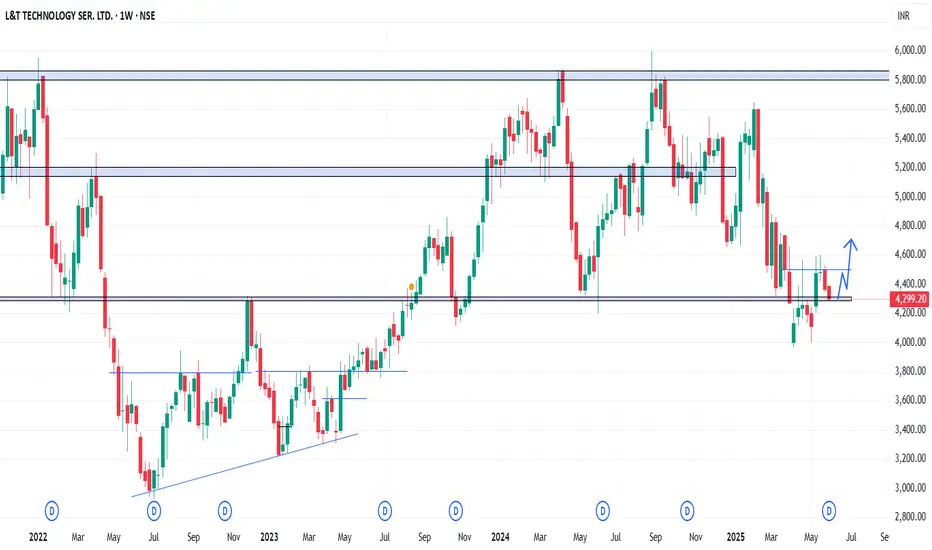
LTTS - Weekly AnalysisIn the Weekly Chart of LTTS ,
we can see that, it has retested properly and now its ready for up move.
Expected momentum is shown in chart.
See all ideas
Summarizing what the indicators are suggesting.
Neutral
SellBuy
Strong sellStrong buy
Strong sellSellNeutralBuyStrong buy
Neutral
SellBuy
Strong sellStrong buy
Strong sellSellNeutralBuyStrong buy
Neutral
SellBuy
Strong sellStrong buy
Strong sellSellNeutralBuyStrong buy
An aggregate view of professional's ratings.
Neutral
SellBuy
Strong sellStrong buy
Strong sellSellNeutralBuyStrong buy
Neutral
SellBuy
Strong sellStrong buy
Strong sellSellNeutralBuyStrong buy
Neutral
SellBuy
Strong sellStrong buy
Strong sellSellNeutralBuyStrong buy
Displays a symbol's price movements over previous years to identify recurring trends.
MIDCAPETF
Mirae Asset Nifty Midcap 150 ETF Exchange Traded Fund UnitsWeight
0.28%
Market value
418.68 K
USD
Explore more ETFs
Frequently Asked Questions
The current price of LTTS is 3,704.10 INR — it has decreased by −3.26% in the past 24 hours. Watch L&T Technology Services Ltd. stock price performance more closely on the chart.
Depending on the exchange, the stock ticker may vary. For instance, on NSE exchange L&T Technology Services Ltd. stocks are traded under the ticker LTTS.
LTTS stock has fallen by −2.67% compared to the previous week, the month change is a −14.07% fall, over the last year L&T Technology Services Ltd. has showed a −29.84% decrease.
We've gathered analysts' opinions on L&T Technology Services Ltd. future price: according to them, LTTS price has a max estimate of 5,650.00 INR and a min estimate of 3,590.00 INR. Watch LTTS chart and read a more detailed L&T Technology Services Ltd. stock forecast: see what analysts think of L&T Technology Services Ltd. and suggest that you do with its stocks.
LTTS reached its all-time high on Aug 29, 2024 with the price of 6,000.00 INR, and its all-time low was 712.25 INR and was reached on Jun 30, 2017. View more price dynamics on LTTS chart.
See other stocks reaching their highest and lowest prices.
See other stocks reaching their highest and lowest prices.
LTTS stock is 4.04% volatile and has beta coefficient of 1.43. Track L&T Technology Services Ltd. stock price on the chart and check out the list of the most volatile stocks — is L&T Technology Services Ltd. there?
Today L&T Technology Services Ltd. has the market capitalization of 406.67 B, it has increased by 2.35% over the last week.
Yes, you can track L&T Technology Services Ltd. financials in yearly and quarterly reports right on TradingView.
L&T Technology Services Ltd. is going to release the next earnings report on May 29, 2026. Keep track of upcoming events with our Earnings Calendar.
LTTS earnings for the last quarter are 31.01 INR per share, whereas the estimation was 32.00 INR resulting in a −3.10% surprise. The estimated earnings for the next quarter are 32.88 INR per share. See more details about L&T Technology Services Ltd. earnings.
L&T Technology Services Ltd. revenue for the last quarter amounts to 29.23 B INR, despite the estimated figure of 30.38 B INR. In the next quarter, revenue is expected to reach 29.90 B INR.
LTTS net income for the last quarter is 3.03 B INR, while the quarter before that showed 3.29 B INR of net income which accounts for −7.94% change. Track more L&T Technology Services Ltd. financial stats to get the full picture.
L&T Technology Services Ltd. dividend yield was 1.22% in 2024, and payout ratio reached 45.95%. The year before the numbers were 0.91% and 40.54% correspondingly. See high-dividend stocks and find more opportunities for your portfolio.
As of Feb 12, 2026, the company has 23.34 K employees. See our rating of the largest employees — is L&T Technology Services Ltd. on this list?
EBITDA measures a company's operating performance, its growth signifies an improvement in the efficiency of a company. L&T Technology Services Ltd. EBITDA is 19.43 B INR, and current EBITDA margin is 17.99%. See more stats in L&T Technology Services Ltd. financial statements.
Like other stocks, LTTS shares are traded on stock exchanges, e.g. Nasdaq, Nyse, Euronext, and the easiest way to buy them is through an online stock broker. To do this, you need to open an account and follow a broker's procedures, then start trading. You can trade L&T Technology Services Ltd. stock right from TradingView charts — choose your broker and connect to your account.
Investing in stocks requires a comprehensive research: you should carefully study all the available data, e.g. company's financials, related news, and its technical analysis. So L&T Technology Services Ltd. technincal analysis shows the strong sell today, and its 1 week rating is sell. Since market conditions are prone to changes, it's worth looking a bit further into the future — according to the 1 month rating L&T Technology Services Ltd. stock shows the sell signal. See more of L&T Technology Services Ltd. technicals for a more comprehensive analysis.
If you're still not sure, try looking for inspiration in our curated watchlists.
If you're still not sure, try looking for inspiration in our curated watchlists.