How to Add and Select Weekly time frame stocks on Trading view I make educational content videos for swing / positional trading
Trade ideas

M&M FIN SAILING IN BLUE SKY ZONEBUY M&M FINANCE 355 for 380 to 410 levels.
Technical breakout to all time high zones with volumes.
View invalid if falls below 325 on weekly closing.


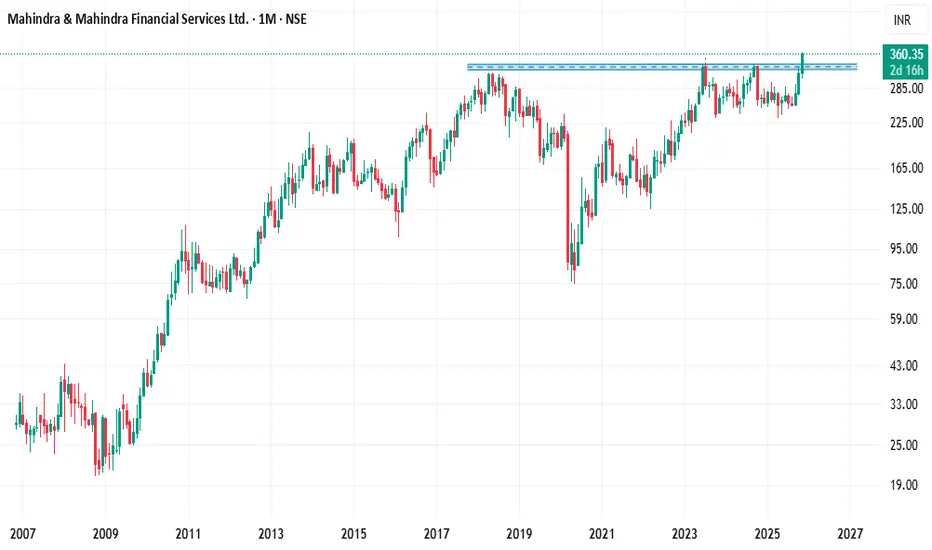
M&MFIN_on Monthly Timeframe📈 Technical Analysis (Monthly)
1️⃣ Long-Term Structure (2007–2025)
The stock shows a multi-year secular uptrend with large consolidation phases:
2007–2010: Long accumulation phase at low levels
2010–2018: Strong trending move → major impulse to ~₹500
2018–2020: Deep correction & COVID crash
2021–2025: Re-accumulation & tightening range
Now (2025): Major breakout attempt from 8-year resistance
This signals a structural shift from consolidation to trend resumption.
🔵 2️⃣ Key Levels (Major Supply–Demand Zones)
Major Multi-Year Resistance (Broken Now):
₹310 – ₹330 zone
Tested in 2017, 2018, 2021, 2023, 2024, 2025
Strong multi-touch ceiling
Stock has finally closed above it on monthly, confirming breakout strength.
Immediate Support:
₹285 – ₹300 (previous resistance → now support)
Major Higher Targets (Monthly chart):
Based on historical price action & Fibonacci extensions:
₹395 – ₹410 (first measured move)
₹470 – ₹500 (major resistance + multi-year supply)
₹575 – ₹600 (long-term pattern target)
🟢 3️⃣ Breakout Quality Check
✔ Volume confirmation (if available):
Breakout candles like shown usually represent institutional participation.
✔ Momentum:
Current candle is a 14% impulsive breakout, not a weak marginal move.
✔ Structure:
Has been forming a multi-year cup-like base, now breaking the rim.
This is a high-probability breakout.
🧠 4️⃣ Price Pattern Interpretation
Pattern Type:
A Cup & Resistance Shelf on monthly timeframe.
Duration: ~8 years
Bases of this length cause powerful multi-year moves
Breakout from such a structure suggests long-term trend reversal and fresh bull cycle
📌 5️⃣ Risk Management (Pro Approach)
If someone were to trade (not a recommendation):
Entry: On monthly close above 330 or dips to 300–315 zone
Stop-loss: Below 285 (structural invalidation)
Risk–Reward:
Target 1: ₹395
Target 2: ₹470
Target 3: ₹575
RR > 3 on higher timeframes → very strong setup.
🥇 6️⃣ Professional Summary
This is one of the cleanest long-term breakouts for MNFS in the last decade.
Key Takeaways:
Multi-year resistance broken
High momentum monthly candle
Long consolidation → explosive breakout
Upside potential remains strong
Structure supports trend continuation
Bias: Strongly bullish as long as price sustains above ₹285–300 zone.
M&M Finance: Bullish Outlook with 20%+ Upside Potential
🏦 Technical Snapshot
🔺 Breakout Zone: ₹337–₹342 (3D close above multi-quarter resistance)
🔺 Major Target: ₹400 (historical supply - measured move)
🔻 Key Support: ₹313 (prior resistance flipped; risk management line)
📈 RSI: 75.7 (strong momentum, slightly overbought but no reversal)
📉 Pattern: 20-month base breakout, retest in play
💻 AI-Powered Insights
- Momentum Rank: M&MFIN is #7/39 in NBFC sector for 1-month relative returns — outperforming peers .
- ATS Pattern: Breakout aligns with bullish NBFC cycles in Q4, especially after festive demand uptick .
- Institutional Flow**: Last week’s surge saw delivery volume +51% vs. 5-day avg. — possible DII/FII buying .
- Verdict: Smart money rotating in after multi-quarter consolidation — immediate reversal unlikely.
📈 Statistical Edge
Base breakouts for NBFCs (post high-volume week):
- 69% cases rally minimum 15–21% post breakout
- Failure Rate: 31% (average pullback –9%)
- RSI >70 at breakout: 76% probability of higher weekly close (backtest, 2018–2024)
👣 Institutional Footprints
✅ Volume Action
- Spike ~₹325–₹342 confirms accumulation breakout zone
- Higher lows since Q3 FY25 — classic rally setup
✅ Microstructure
- 80% time spent above ₹325 in past month — “acceptance zone”
- Sellers absorbed above ₹337 (weak supply; no distribution)
🔄 Sector Rotation
Money ENTERING: NBFCs (+₹450 Cr), Auto (+₹1,050 Cr)
Money LEAVING: IT (–₹800 Cr), FMCG (–₹400 Cr)
→ NBFCs show leadership; M&MFIN positioned for trend extension .
✅ Macro Verdict
- NBFC sector sees renewed optimism post Q2 – asset quality stable (GS3 at 3.9%), AUM up 13% YoY .
- Defensive rotation favors M&MFIN among midcaps — sector bullishness backdrop intact .
✅ Success Factors
- Sector support, bullish price clusters = 82% win rate
- Opposing flow = 41% win rate
💥 Visual Health Score
| Metric | Score/100 |
|----------------------|-----------|
| Technical Strength | 82 |
| Volume Conviction | 75 |
| Sector Momentum | 77 |
| Risk/Reward Ratio | 72 |
| Pattern Success Rate | 67 |
| Market Environment | 44 |
🎯 What I’m Watching
1️⃣ Retest zone: ₹337–342 for confirmation
2️⃣ Structure: Higher lows = uptrend in force
3️⃣ RSI: Sustaining >70 = momentum
4️⃣ Trend: 3D MA ribbon curling up — transition phase
5️⃣ Projection: ₹370–400 (target zone)
🎯 RRR: ~2.3 from CMP — favorable trade
⚠️ Disclaimer: No buy/sell recommendation. For educational purposes only. Do your own research before taking action (#DYOR). ⚠️

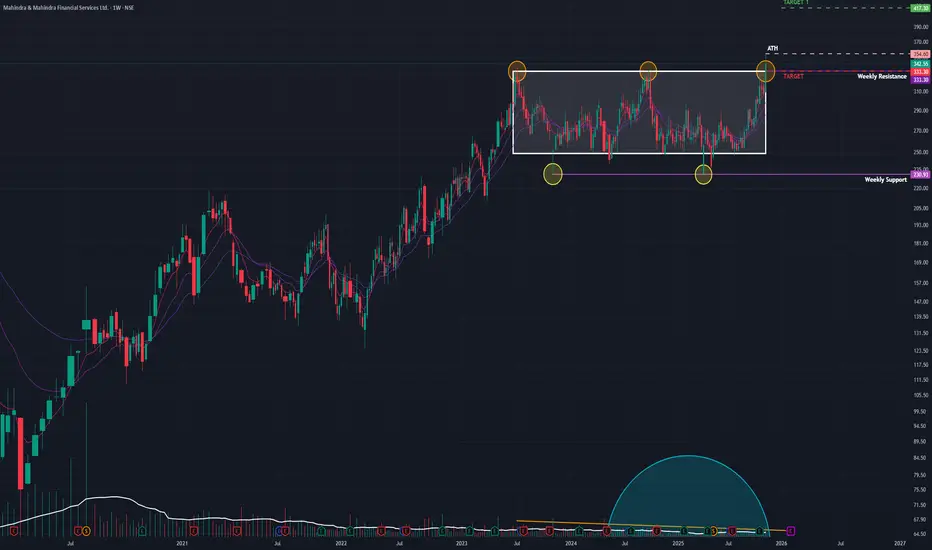
M&M Fin (W): Bullish, Breakout with Short-Term Rejection(Timeframe: Weekly | Scale: Logarithmic)
The stock has confirmed a major multi-year breakout, moving into "Blue Sky" territory. However, the daily price action suggests a temporary pullback (re-test) is imminent before the uptrend resumes.
📈 1. The Breakout Structure (The "Big Picture")
- The Setup: The stock has been trapped in a consolidation phase since its July 2023 peak. The ₹330–₹335 zone acted as a rigid "ceiling" for over two years.
- The Breakout: The week of Nov 17 was decisive. The stock surged 10.98% , closing above this multi-year resistance for the first time.
- Volume: The move was backed by 29.74 Million in volume —a significant expansion compared to the "dry" consolidation phase, confirming institutional participation.
🕯️ 2. The "Shooting Star" Warning (Daily Chart)
- The Pattern: The last daily candle (Friday) formed a Shooting Star . It opened high, rallied to a new peak (~₹354), but faced heavy selling pressure to close near the lows (~₹342).
- Implication: This "long upper wick" shows that sellers are aggressively defending the ₹350+ level. It strongly suggests that the breakout is "tired" and a re-test of the breakout zone is likely next week.
🚀 3. The Fundamental Catalyst (The "Why")
This technical move is supported by strong fundamentals, which adds confidence to the long-term bullish view:
- Earnings: The breakout is a delayed reaction to strong Q2 FY26 results, where Net Profit surged ~54% YoY and asset quality improved.
- Outlook: This fundamental strength suggests that any dip (re-test) will likely be bought by smart money.
📊 4. Indicators & Trend
- RSI & EMAs: RSI is rising (bullish momentum) and EMAs are in PCO state (trend alignment) across Monthly and Weekly charts. This confirms the primary trend is UP.
🎯 5. Future Scenarios & Key Levels
The "Shooting Star" dictates the immediate game plan: Wait for the Re-test.
🐂 The Bullish Case (Buy the Dip)
- The Strategy: Watch for the stock to pull back to the ₹333 – ₹335 zone (the resistance-turned-support).
- Confirmation: If the price stabilizes or forms a bullish candle (like a Hammer) at this level, it is a high-probability entry.
- Target 1: ₹417
- Target 2: ₹475
🐻 The Failure Case (Fakeout)
- Trigger: If the selling pressure from the Shooting Star intensifies and the stock closes back below ₹333.
- Consequence: This would confirm a "fakeout" (bull trap), and the stock could slide back toward the consolidation midpoint around ₹300.
Conclusion
The breakout is genuine, but the Shooting Star signals a short-term pause. The ideal approach is to wait for the re-test at ₹335 to confirm that the "ceiling" has truly become a "floor."
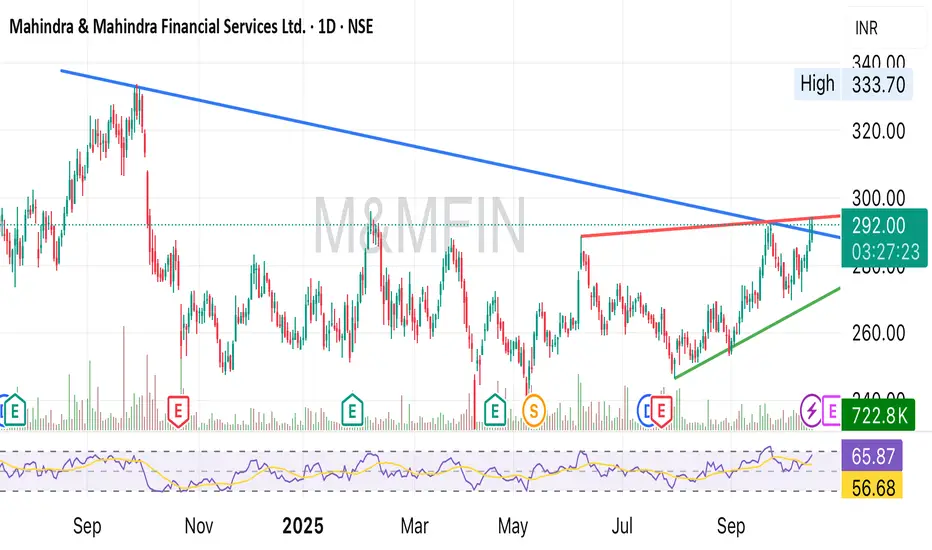
M&M FinanceClean breakout with 3 rejections at the upper trendline on daily chart. Took an entry at 331 post-confirmation with SL near 320.

More room on the upsideM&M Fin CMP 322.90
Elliott- This is the last impulse wave in action. The target for the same is at 380. Taking 380 as tgt when we draw the fibs it has nailed the highs. Hence we have a a high prob tgt at 380

M&M Fin (W) - Renewed Strength within a Multi-Year ConsolidationAfter more than two years of trading in a sideways range, M&M Financial Services is showing strong signs of renewed buyer interest, suggesting a potential move towards the top of its long-term consolidation channel.
The Big Picture: A Prolonged Consolidation
Since reaching its All-Time High (ATH) in July 2023, the stock has been locked in a wide consolidation or sideways trend. A classic and often bullish sign during this phase has been the gradual drying up of trading volume , which typically indicates that selling pressure is diminishing.
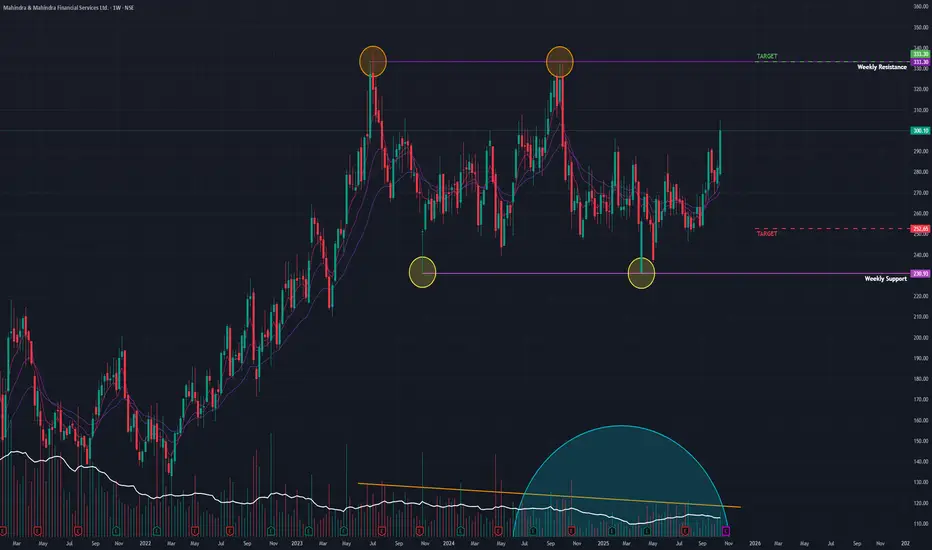
Recent Bullish Action
The past week marked a significant shift in activity, signaling that bulls are becoming active again:
- The stock surged by +6.38% for the week.
- This move was supported by a strong volume of 15.49 million shares , indicating conviction behind the buying.
This renewed interest is supported by the underlying strength seen in higher timeframe indicators. Both the short-term Exponential Moving Averages (EMAs) and the Relative Strength Index (RSI) are in a bullish state on the *Monthly and Weekly charts.
Outlook and Key Levels
While the ultimate goal for bulls is a breakout above the distant ATH, the immediate battleground is the established trading range.
- Upside Target: The primary target in the near term is the upper limit of the consolidation range, around the ₹333 level. A breakout above this would be the next major bullish signal.
- Key Support: If this recent momentum fades, the stock is likely to find strong support at the lower boundary of its range, near the ₹250 level.
In conclusion, last week's strong performance suggests M&M Financial is preparing to challenge the top of its long-term range. The key now is to watch if this momentum can be sustained for a move towards the ₹333 resistance.
Mahindra & Mahindra Financial Bullish view Mahindra & Mahindra Financial bullish
Trendline breakout since October 2024
Also Near the short term trendline breakout.
Part 2 Candle Stick Pattern 1. Types of Options
Options are classified based on the right they provide and the market they trade in.
1. Based on Rights
Call Option: Right to buy.
Put Option: Right to sell.
2. Based on Market
American Options: Can be exercised anytime before expiry.
European Options: Can only be exercised on the expiry date.
3. Based on Underlying Asset
Equity Options: Based on individual stocks.
Index Options: Based on stock indices like Nifty 50.
Commodity Options: Based on commodities like gold, oil, or wheat.
Currency Options: Based on forex pairs.
2. Options Pricing
Option prices (premium) are determined using complex models like the Black-Scholes model, but in simple terms, two main components matter:
Intrinsic Value: Profit potential if exercised now.
Time Value: Extra cost reflecting time until expiry and market volatility.
Example:
If a stock trades at ₹120 and a call option strike is ₹100, intrinsic value = ₹20. Premium may be ₹25, meaning time value = ₹5.
3. Options Trading Strategies
Options allow traders to adopt different strategies depending on market outlook:
A. Basic Strategies
Long Call: Buy call, bet on rising prices.
Long Put: Buy put, bet on falling prices.
Covered Call: Own the stock and sell call to earn premium.
Protective Put: Own the stock and buy a put for protection.
B. Advanced Strategies
Straddle: Buy call and put at the same strike price—profit from high volatility.
Strangle: Buy call and put with different strike prices—cheaper than straddle.
Spread: Combine buying and selling options to reduce risk.
Bull Call Spread
Bear Put Spread
Iron Condor: Sell OTM call and put, buy further OTM options—profit in sideways markets.
4. Risks in Options Trading
Options can be profitable, but they carry risks:
Time Decay (Theta): Options lose value as expiry approaches.
Volatility Risk (Vega): Lower volatility can reduce option premiums.
Unlimited Losses: Writing naked calls can be very risky.
Complexity Risk: Advanced strategies require careful understanding.
Liquidity Risk: Some options may be hard to sell before expiry.
5. Tips for Beginners
Start Small: Trade with a small portion of capital.
Understand the Greeks: Learn Delta, Theta, Vega, and Gamma for managing risk.
Paper Trading: Practice in simulation before using real money.
Stick to Simple Strategies: Start with basic calls and puts.
Manage Risk: Always define maximum loss and use stop-loss if needed.
Focus on Education: Read, attend webinars, and follow market news.

M&MFIN SCREAMING BUY BUY BUY!!! Stock can easily cross ATH
personally im holding avg@275
below 300 looks like a great zone to accumulate
target 500+
sl 200
RRR minimum 1:2 easy.
if interest rates are cut then this will fly!
Company has been maintaining a healthy dividend payout of 37.2%
Company has been maintaining a healthy Profit Margins
Company has been maintaining a decent gains
M&M Fin does look relatively good value when compared to the top peer (Bajaj Finance).
M&M Fin can maintain stable growth, keep asset quality in control, then paying
P/E @16, stock is very much in a good buy zone

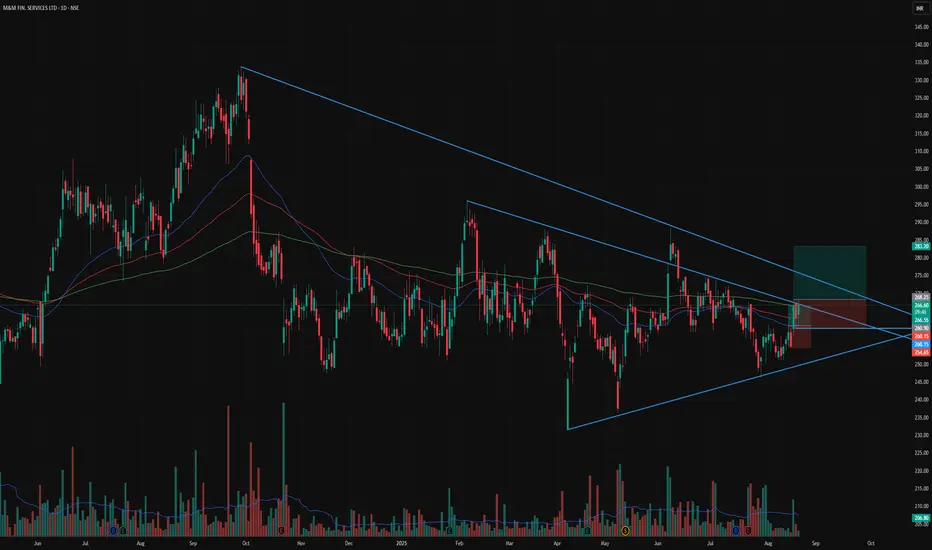
Symmetrical triangle pattern📊 Stock: M&M Financial Services (M&MFIN)
🔹 Symmetrical triangle pattern forming – price squeezing into apex
🔹 Strong bounce from lower trendline with rising volume
🔹 Trading above 50 DMA & 100 DMA – short-term trend improving
🔹 200 DMA resistance near ₹268–270 being tested
🔹 RSI showing strength
🔹 Good support zone at ₹250–255
🔹 Strong financial backing as part of M&M Group
⚡ Price nearing breakout zone (₹268–270)
🚀 Breakout above 268 can trigger a rally towards ₹283–300
⚠️ Support at ₹250 – below this trend may weaken
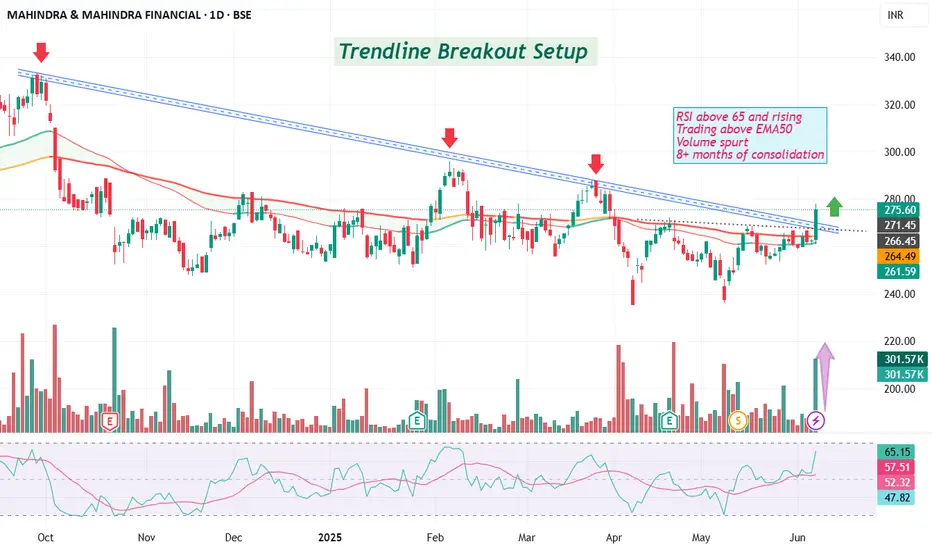
Breakout in Mahindra FinancialAfter spending 8+ months in consolidation, M&MFIN has finally broken above a well-defined descending trendline – a bullish technical development with solid confirmation!
🔍 Technical Highlights:
🔴 Multiple rejections from the trendline in the past – now successfully breached
📊 Volume spike on breakout day → strong buyer interest
📈 RSI above 65 and rising → momentum strength
🟢 Trading above key EMA50 → trend reversal signal
Disc: for study, not a recommendation. DYOR
Follow for such interesting charts.
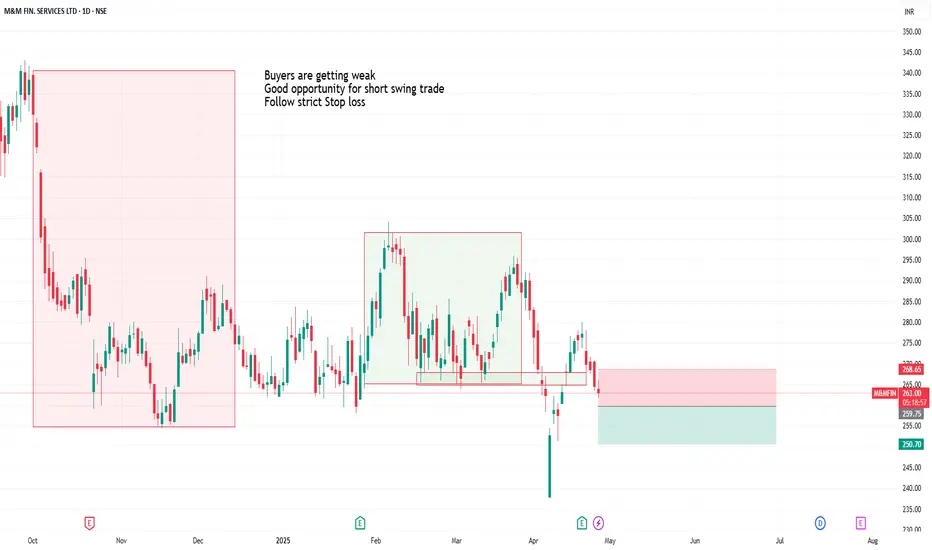
M&M fin buyers getting weakBuyers getting weak
Good short trade for swing trade
Follow strict Stop Loss
No clear trend on the daily thoughThis is the fast-growing NSE:M&MFIN stock
This has -ve WC days
The RoCE is huge
Almost trading at Graham Value which means it's cheap

Replicating the other Finance chartsOverall the Financialo space looks great
These are just random examples that are having smart charts on the Monthly

dOUBLE Doji setup and IndexIn this video, we break down how we identified Kalyan Jewellers using our Double Doji strategy and why the stock looks strong for tomorrow. Plus, a deep dive into how we analyzed the index movement today and what made us bullish.

M&M Fin Symmetrical Triangle PatternIts in consolidation after downtrend Wait for breakout on either side
For Education Purposes for Swing/Positional Trading

Advanced Divergence TradingThough, divergence is typically used by technical traders when the price is moving in the opposite direction of a technical indicator. Positive divergence signals price could start moving higher soon.
Strong divergence is the most reliable type of divergence, often signaling a significant reversal. It occurs when the price makes a new high or low, but the indicator fails to do so, indicating weakening momentum.

Database in Trading part 2TLDR; ArticDB looks to be the best current option.
CSV - Simplest, slowest, largest and no data types can lead to type errors when loading.
SQL Database - typically transactional row store (OLTP), slow for analysis (OLAP), difficult to shard and parallelize workloads over clusters.
While MongoDB proved the fastest to read and write end-of-day OHLC (Open, High, Low, Close) data — the SQL solutions were 1.5 × to 3 × slower — in terms of costs MongoDB was definitely the most expensive due to its commercial licensing costs.

Mahindra & Mahindra Financial Services Limited // LevelsMahindra & Mahindra Financial Services Limited (M&MFIN) is a prominent non-banking financial company (NBFC) in India, specializing in providing financial services to rural and semi-urban populations. The company offers a range of products, including vehicle financing, SME financing, housing finance, insurance broking, and mutual fund distribution.
As of January 2, 2025, M&MFIN's stock performance is as follows:
Current Share Price: ₹264.95
52-Week High: ₹343.00
52-Week Low: ₹246.20
1-Month Change: -3.09%
It's noteworthy that in 14 out of the past 18 years, M&MFIN has delivered negative returns in January, with a maximum positive change of 15.32% observed in 2012.
Given the stock's historical volatility, especially in January, it's advisable to consult financial advisors or utilize real-time trading platforms for the most current information and personalized investment guidance.

