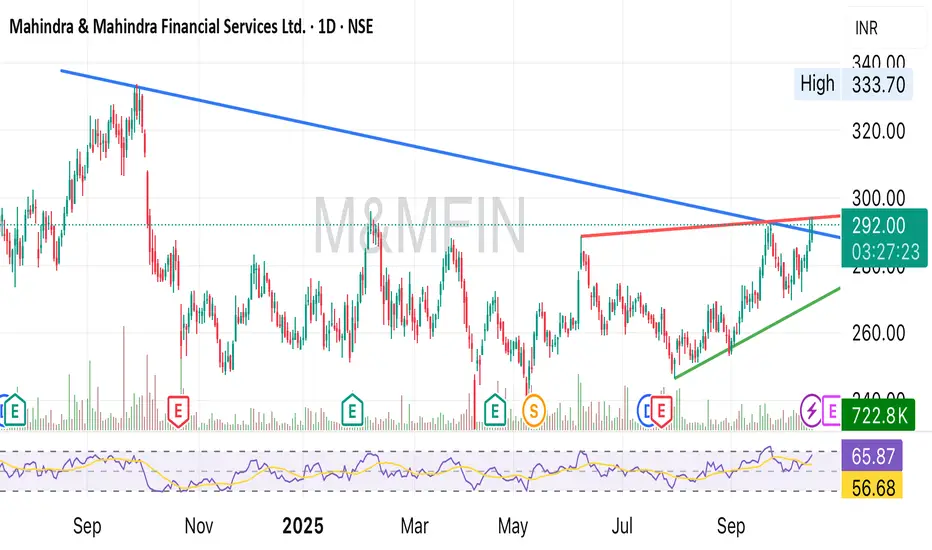
Mahindra & Mahindra Financial Bullish view Mahindra & Mahindra Financial bullish
Trendline breakout since October 2024
Also Near the short term trendline breakout.
Trade ideas
Part 2 Candle Stick Pattern 1. Types of Options
Options are classified based on the right they provide and the market they trade in.
1. Based on Rights
Call Option: Right to buy.
Put Option: Right to sell.
2. Based on Market
American Options: Can be exercised anytime before expiry.
European Options: Can only be exercised on the expiry date.
3. Based on Underlying Asset
Equity Options: Based on individual stocks.
Index Options: Based on stock indices like Nifty 50.
Commodity Options: Based on commodities like gold, oil, or wheat.
Currency Options: Based on forex pairs.
2. Options Pricing
Option prices (premium) are determined using complex models like the Black-Scholes model, but in simple terms, two main components matter:
Intrinsic Value: Profit potential if exercised now.
Time Value: Extra cost reflecting time until expiry and market volatility.
Example:
If a stock trades at ₹120 and a call option strike is ₹100, intrinsic value = ₹20. Premium may be ₹25, meaning time value = ₹5.
3. Options Trading Strategies
Options allow traders to adopt different strategies depending on market outlook:
A. Basic Strategies
Long Call: Buy call, bet on rising prices.
Long Put: Buy put, bet on falling prices.
Covered Call: Own the stock and sell call to earn premium.
Protective Put: Own the stock and buy a put for protection.
B. Advanced Strategies
Straddle: Buy call and put at the same strike price—profit from high volatility.
Strangle: Buy call and put with different strike prices—cheaper than straddle.
Spread: Combine buying and selling options to reduce risk.
Bull Call Spread
Bear Put Spread
Iron Condor: Sell OTM call and put, buy further OTM options—profit in sideways markets.
4. Risks in Options Trading
Options can be profitable, but they carry risks:
Time Decay (Theta): Options lose value as expiry approaches.
Volatility Risk (Vega): Lower volatility can reduce option premiums.
Unlimited Losses: Writing naked calls can be very risky.
Complexity Risk: Advanced strategies require careful understanding.
Liquidity Risk: Some options may be hard to sell before expiry.
5. Tips for Beginners
Start Small: Trade with a small portion of capital.
Understand the Greeks: Learn Delta, Theta, Vega, and Gamma for managing risk.
Paper Trading: Practice in simulation before using real money.
Stick to Simple Strategies: Start with basic calls and puts.
Manage Risk: Always define maximum loss and use stop-loss if needed.
Focus on Education: Read, attend webinars, and follow market news.

M&MFIN SCREAMING BUY BUY BUY!!! Stock can easily cross ATH
personally im holding avg@275
below 300 looks like a great zone to accumulate
target 500+
sl 200
RRR minimum 1:2 easy.
if interest rates are cut then this will fly!
Company has been maintaining a healthy dividend payout of 37.2%
Company has been maintaining a healthy Profit Margins
Company has been maintaining a decent gains
M&M Fin does look relatively good value when compared to the top peer (Bajaj Finance).
M&M Fin can maintain stable growth, keep asset quality in control, then paying
P/E @16, stock is very much in a good buy zone

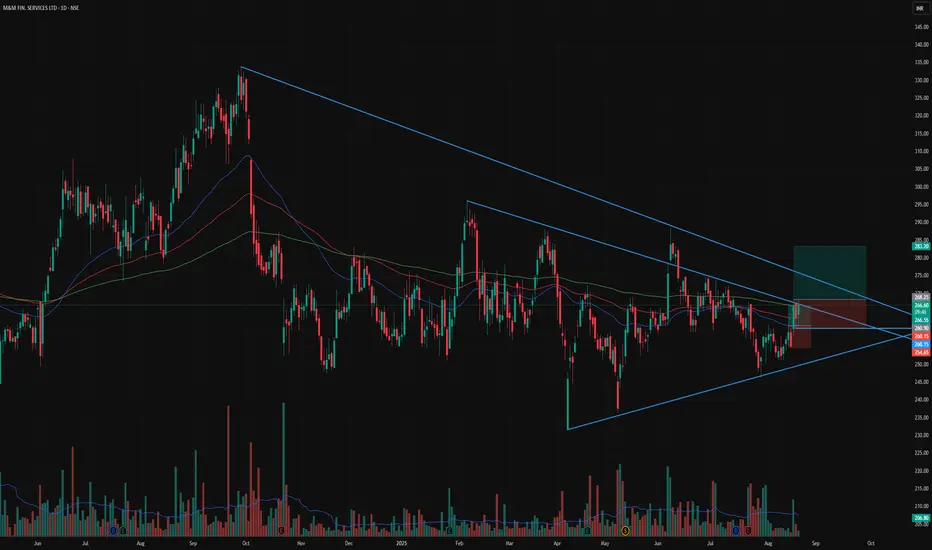
Symmetrical triangle pattern📊 Stock: M&M Financial Services (M&MFIN)
🔹 Symmetrical triangle pattern forming – price squeezing into apex
🔹 Strong bounce from lower trendline with rising volume
🔹 Trading above 50 DMA & 100 DMA – short-term trend improving
🔹 200 DMA resistance near ₹268–270 being tested
🔹 RSI showing strength
🔹 Good support zone at ₹250–255
🔹 Strong financial backing as part of M&M Group
⚡ Price nearing breakout zone (₹268–270)
🚀 Breakout above 268 can trigger a rally towards ₹283–300
⚠️ Support at ₹250 – below this trend may weaken
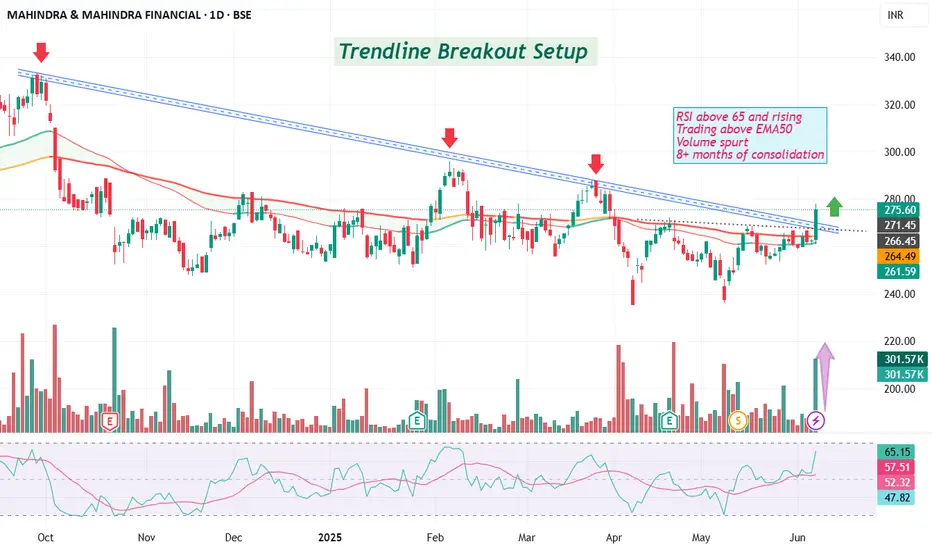
Breakout in Mahindra FinancialAfter spending 8+ months in consolidation, M&MFIN has finally broken above a well-defined descending trendline – a bullish technical development with solid confirmation!
🔍 Technical Highlights:
🔴 Multiple rejections from the trendline in the past – now successfully breached
📊 Volume spike on breakout day → strong buyer interest
📈 RSI above 65 and rising → momentum strength
🟢 Trading above key EMA50 → trend reversal signal
Disc: for study, not a recommendation. DYOR
Follow for such interesting charts.
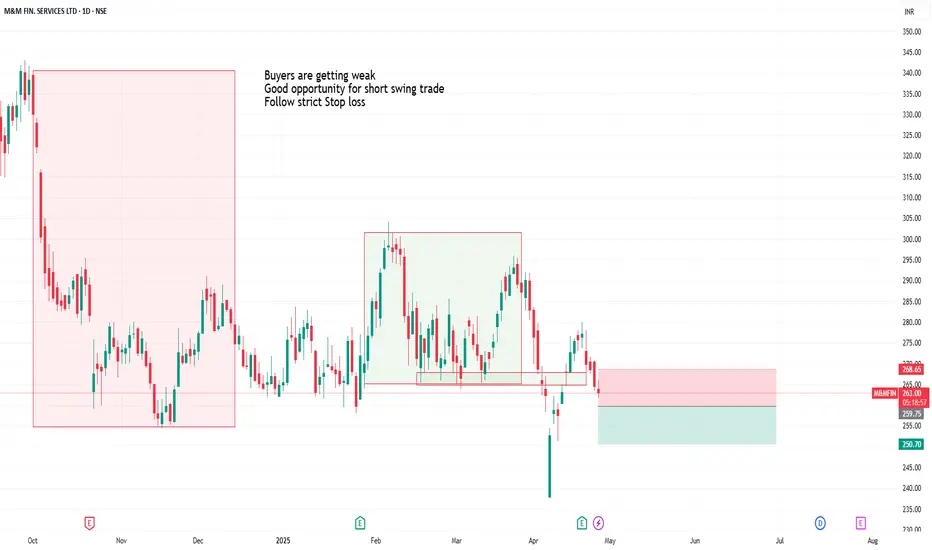
M&M fin buyers getting weakBuyers getting weak
Good short trade for swing trade
Follow strict Stop Loss
No clear trend on the daily thoughThis is the fast-growing NSE:M&MFIN stock
This has -ve WC days
The RoCE is huge
Almost trading at Graham Value which means it's cheap

Replicating the other Finance chartsOverall the Financialo space looks great
These are just random examples that are having smart charts on the Monthly

dOUBLE Doji setup and IndexIn this video, we break down how we identified Kalyan Jewellers using our Double Doji strategy and why the stock looks strong for tomorrow. Plus, a deep dive into how we analyzed the index movement today and what made us bullish.

M&M Fin Symmetrical Triangle PatternIts in consolidation after downtrend Wait for breakout on either side
For Education Purposes for Swing/Positional Trading

Advanced Divergence TradingThough, divergence is typically used by technical traders when the price is moving in the opposite direction of a technical indicator. Positive divergence signals price could start moving higher soon.
Strong divergence is the most reliable type of divergence, often signaling a significant reversal. It occurs when the price makes a new high or low, but the indicator fails to do so, indicating weakening momentum.

Database in Trading part 2TLDR; ArticDB looks to be the best current option.
CSV - Simplest, slowest, largest and no data types can lead to type errors when loading.
SQL Database - typically transactional row store (OLTP), slow for analysis (OLAP), difficult to shard and parallelize workloads over clusters.
While MongoDB proved the fastest to read and write end-of-day OHLC (Open, High, Low, Close) data — the SQL solutions were 1.5 × to 3 × slower — in terms of costs MongoDB was definitely the most expensive due to its commercial licensing costs.

Mahindra & Mahindra Financial Services Limited // LevelsMahindra & Mahindra Financial Services Limited (M&MFIN) is a prominent non-banking financial company (NBFC) in India, specializing in providing financial services to rural and semi-urban populations. The company offers a range of products, including vehicle financing, SME financing, housing finance, insurance broking, and mutual fund distribution.
As of January 2, 2025, M&MFIN's stock performance is as follows:
Current Share Price: ₹264.95
52-Week High: ₹343.00
52-Week Low: ₹246.20
1-Month Change: -3.09%
It's noteworthy that in 14 out of the past 18 years, M&MFIN has delivered negative returns in January, with a maximum positive change of 15.32% observed in 2012.
Given the stock's historical volatility, especially in January, it's advisable to consult financial advisors or utilize real-time trading platforms for the most current information and personalized investment guidance.


Option trading Options are a type of contract that gives the buyer the right to buy or sell a security at a specified price at some point in the future. An option holder is essentially paying a premium for the right to buy or sell the security within a certain time frame.
Trading options offers a number of benefits for an active trader: Options can offer high returns and do so over a short period, allowing you to multiply your money quickly if your wager is right. With options, it can cost less to get the same exposure to a stock's price movement than it does to buy the stock directly.

Option chain in trading An option chain primarily focuses on options contracts associated with an underlying asset, such as stocks, commodities, or indices. It provides information about the available options, their strike prices, expiration dates, bid-ask prices, and other contract-specific data.
Nifty option chain is considered to be the best advance warning system of sharp moves or break outs in the index.

database trading SQL remains a fundamental tool for querying and managing data. SQL's simplicity and power make it accessible to both beginners and experts. In trading systems, SQL enables efficient data retrieval and manipulation. Users can write SQL queries to analyze market trends and execute trading strategies.
The United Nations Commodity Trade Statistics Database (UN Comtrade) contains detailed imports and exports statistics reported by statistical authorities of close to 200 countries or areas. It concerns annual trade data from 1962 to the most recent year.

Option chain An option chain is a comprehensive list that shows you all available option contracts for a given stock. These are sorted by their expiration date, which is the last day you can trade or use the option, and strike price, which is the price at which you can buy (call) or sell (put) the stock.2
What is Implied Volatility (IV)? Implied Volatility (IV) uses an option price to determine and calculate what the current market is talking about, the future volatility of the option's underlying stock. Implied volatility is one of the six essential factors used in options pricing models.

Bullish SharkIn M&M Fin Serv (M&MFIN) a Bullish Shark formed and took Type 1 Reversal and Price is coming to retest Reversal Zone for Type 2 Reversal.


my fave stock next 30 days movemy favee stock next 30 days move in m&m fin . demande zone work make hammer last day

M&M Financials - Near another breakoutChart is self explanatory. Entry, Targets and Stop Loss are mentioned on the chart.
Disclaimer: This is for demonstration and educational purpose only. This is not buying or selling recommendations. I am not SEBI registered. Please consult your financial advisor before taking any trade.

Keep in Radar (M&M Finance)The moving averages are converging. The price is trading above the short and med term moving average. RSI is also supportive. CNX finance also in uptrend. Can see a move in this soon:)
