#Maruti cash : Looks good above 7300.10#Maruti cash
22.06.2021
Looks good above 7300.10
stoploss 7240
Target 7358-60/7440
Cmp 7265.40
MARUTI trade ideas

Maruti - Inverted Head and Shoulders (INHS) ViewMaruti :
Looks ready for INHS Breakout
Long above 7400 with a SL 7250


Inverted H&S pattern - strongly bullishMaruti is forming a long term inverted Head & Shoulder pattern. A huge breakout is expected after the first target is hit in the coming months. Treadling and pattern breakout is likely to happen


MARUTI - HEAD & SHOULDER PATTERN BREAKDOWN POSSIBLEMARUTI IS FORMING H & S PATTERN ON A WEEKLY CHART
SHORT @6900-6950
TARGET - 6440 / 5860
STOPLOSS - 7250

[Turtle] Maruti Consolidation BetIt should be 6700PE.
Plan -
If 6800 breaks, Sell 7000CE.
Close the trade if 6600-7200 breaches by month end.
Note -
One of the best forms of Price Action is to not try to predict at all. Instead of that, ACT on the price. So, this chart tells at "where" to act in "what direction. Unless it triggers, like, let's say the candle doesn't break the level which says "Buy if it breaks", You should not buy at all.
=======
I use shorthands for my trades.
"Positional" - means You can carry these positions and I do not see sharp volatility ahead. (I tally upcoming events and many small kinds of stuff to my own tiny capacity.)
"Intraday" -means You must close this position at any cost by the end of the day.
"Theta" , "Bounce" , "3BB" or "Entropy" - My own systems. Please refer to the link to my footer and explore further if You want.
=======
I won't personally follow any rules. If I "think" (It is never gut feel. It is always some reason.) the trade is wrong, I may take reverse trade. I may carry forward an intraday position. What is meant here - You shouldn't follow me because I may miss updating. You should follow the system I share.
=======
Like -
Always follow a stop loss.
In the case of Intraday trades, it is mostly the "Day's High".
In the case of Positional trades, it is mostly the previous swings.
I do not use Stop Loss most of the time. But I manage my risk with options as I do most of the trades using derivatives.
I also do my trades live, Please refer to the link to my footer if you want to tail me.
=======


Maa RottiI have added Maruti at 6800. Will add more at 6500 . My stop loss of 6200 on closing basis. I am gunning for 8500 levels in mid term and 12500 levels over a period of 18-24 months

Maruti Shortbearish trusting line pattern in uptrend - Possible retracement
Sell at 7200
Target - 7000, 6850
SL - 7340


Maruti in Cup & handle Chart PatternKEY TAKEAWAYS
A cup and handle is a technical chart pattern that resembles a cup and handle where the cup is in the shape of a "u" and the handle has a slight downward drift.
A cup and handle is considered a bullish signal extending an uptrend, and is used to spot opportunities to go long.
Technical traders using this indicator should place a stop buy order slightly above the upper trendline of the handle part of the pattern.
For Educational Purpose Only

I hope Maruti can bounce from its 20 movingNSE:MARUTI - I have holding of it at 6600 levels, hoping to see a bounce from it's 20 EMA. What's your thoughts?

Inverted Head and Shoulders Position in Maruti SuzukiOn Daily charts it seems that Maruti Suzuki is creating a Inverted Head and Shoulders Position. If it breaks the neckline at the level of 8000-8200 then it may reach upto 12000-12500 by December 21 end ( Hopefully No third wave of Corona). Lets see if my analysis goes correct.

Inverted Head and Shoulders in Maruti SuzukiOn Daily charts it seems that Maruti Suzuki is creating a Head and Shoulders Position.. it it breaks the neckline at the price around 8000-8200.. then it can reach upto the level of 12000-12500 by the Year end of 2021 ( Hopefully No third wave of Corona and). Lets see if my analysis goes correct.

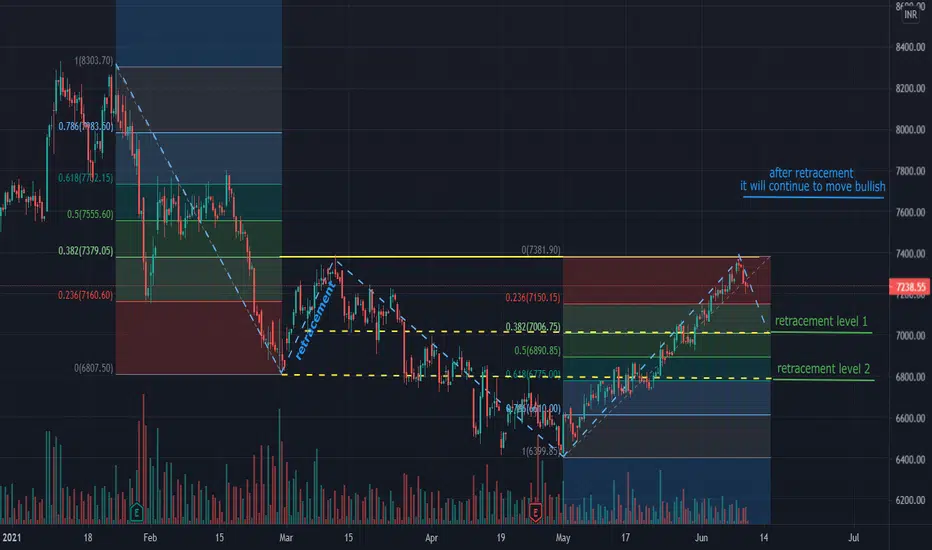
MARUTI retracement in bullish moveFibonacci is one of the important tool to predict and understand the retracement of the stock.
MARUTI SUZUKI was in down trend since mid of Feb started retracement on 26th of Feb around 8610 and retraced by 38.2% till 7372, which is also a price at the current date. after this retracement it continued the down trend.
A trend reversal is observed on 30th of April and stock moved bullish since then. Now, it has reached to the high of the symmetric level from past retracement (7372). It expected to retrace atleast by 38.2% or to max to the level of 61.8%.
pls keep an eye on it and pls comment your observations too.
Maruti, Ready for long trade. MARUTI
moving inside a very good channel pattern, once this hourly candle closes above channel support we can go long.
SL will be very small.
***DO YOUR SELF ANALYSIS***

maruti based on weeklybased on previous view it may pull back in comming weeks & MACD is positive in last week. keep watching breakout or break down what will happen in comming session.
