Don’t Miss This Rare MCX Setup Breakout + Retest= Big Move AheadHello Traders!
Today’s analysis is on MCX Ltd., where we just spotted a powerful Descending Triangle Breakout . After weeks of consolidation, the price has finally broken the falling resistance and even retested the breakout zone. This setup often leads to a strong trending move.
Why this setup is special?
Price respected support multiple times, showing heavy demand from lower levels.
Breakout + Retest makes it one of the most reliable continuation patterns.
Risk–Reward is highly favorable for both short-term and positional traders.
Levels to Track:
Currently, the best accumulation zone lies between 8000–8155 , which gives a low-risk entry point. On the upside, the immediate short-term target is around 8446 , while the medium-term level aligns with the previous ATH near 9115 . If momentum sustains, the stock even has potential to reach the positional target of 9774 . For risk management, traders can keep a short to medium-term stop loss at 7788 , while positional traders may consider a wider SL at 7522 .
Rahul’s Tip:
Such breakouts don’t come often. Once the retest is done, the real rally usually begins. Traders who wait too long often end up chasing the move at much higher prices.
If you want to catch these setups before they take off, make sure you follow closely — (Analysis By @TraderRahulPal, TradingView Moderator). More analysis & educational content is shared regularly on my profile. Sometimes one breakout can change your trading month completely. If this helped you, don’t forget to like and follow for regular updates.
Disclaimer:
This analysis is for educational purposes only and should not be taken as financial advice. Please do your own research or consult your financial advisor before investing.
MCX trade ideas

Buy MCX#MCX (Multi Commodity Exchange) Technical Analysis Summary
Current Market Price : ₹8,051.50
Dow Theory Analysis
The chart perfectly demonstrates **Dow Theory principles** in action:
Bullish Structure
Higher Highs : Clear progression from previous peaks
Higher Lows : Each dip maintains above previous lows
Fresh Higher High : Recent peak establishing new uptrend confirmation
Key Technical Levels
Daily Resistance : 8,339.00
Weekly Resistance : 8,901.50
Previous ATH : 9,115.00
Multiple Pattern Confirmations
1. Flag & Pole Pattern : - Bullish continuation pattern Suggests upward momentum continuation
2. Harmonic Pattern :
- Trading near point B
- Activation Level : 8,148.50
- 1st Target : 9,115 (Previous ATH)
- 2nd Target : 9,964 (Current projection)
Do your own analysis before Initiating any Trades.

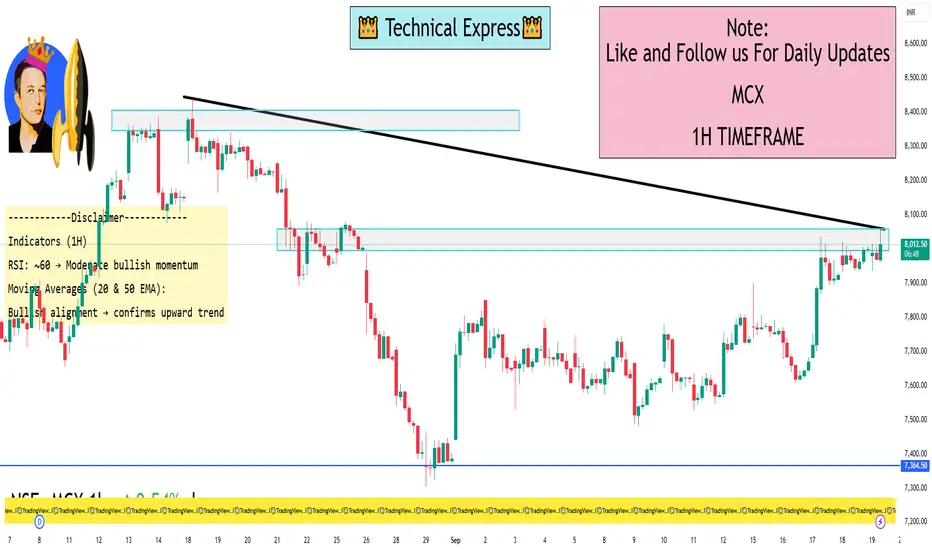
MCX 1 Hour ViewMCX 1-Hour Time Frame Levels (Structured View)
Current Price: ₹8,550 (as of 19th Sep 2025, 11:36 AM IST)
Trend Analysis (1H):
Short-term: Slightly bullish
Price action: Higher highs and higher lows in an upward channel
Key Levels:
Support Levels:
₹8,400 – Major intraday support
₹8,300 – Strong support for potential bounce
Resistance Levels:
₹8,650 – First intraday resistance
₹8,750 – Strong resistance, breakout confirmation above this
Indicators:
RSI (1H): ~60 → Moderate bullish momentum
Moving Averages (1H):
MA 20 above MA 50 → Supports bullish trend
MA alignment confirms upward momentum
Intraday Trading Notes:
Watch price reaction at ₹8,400 and ₹8,650 for reversal or breakout setups
Candlestick patterns near support/resistance levels can indicate entry/exit
Keep an eye on broader market news affecting commodities
MCX Price ActionMCX closed at ₹7,918.50 today, after trading in a volatile range with an intraday low of ₹7,683.00 and a high of ₹8,035.00. The session opened at ₹7,683.00, and robust buying near the lows propelled prices upward, though profit-taking near ₹8,035 capped gains. Technicals remain bullish, with MCX trading above all major moving averages and a 14-day RSI at 56.49, indicating a healthy trend without excessive overbought conditions.
The sustained uptrend is supported by consistently higher lows and strong volume, which was notably above its two-week average. Resistance for MCX is now established around ₹8,035–₹8,040, a close above which could clear the way for a run towards the ₹8,400–₹8,700 levels. Support zones are firmly set at ₹7,680 and ₹7,645; a break below these may invite near-term profit booking. Overall, MCX remains in a positive territory, with traders watching for momentum breakouts above resistance and monitoring for any reversal signals at support.
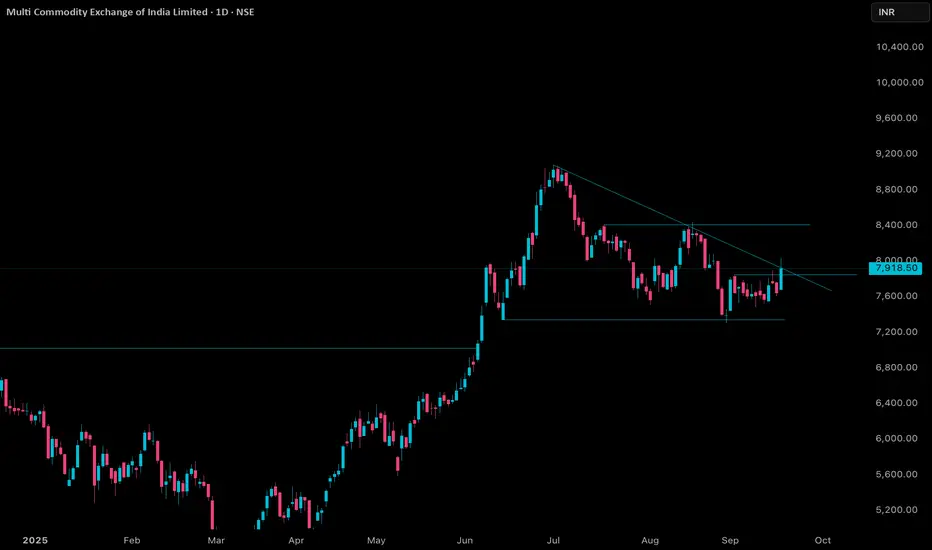
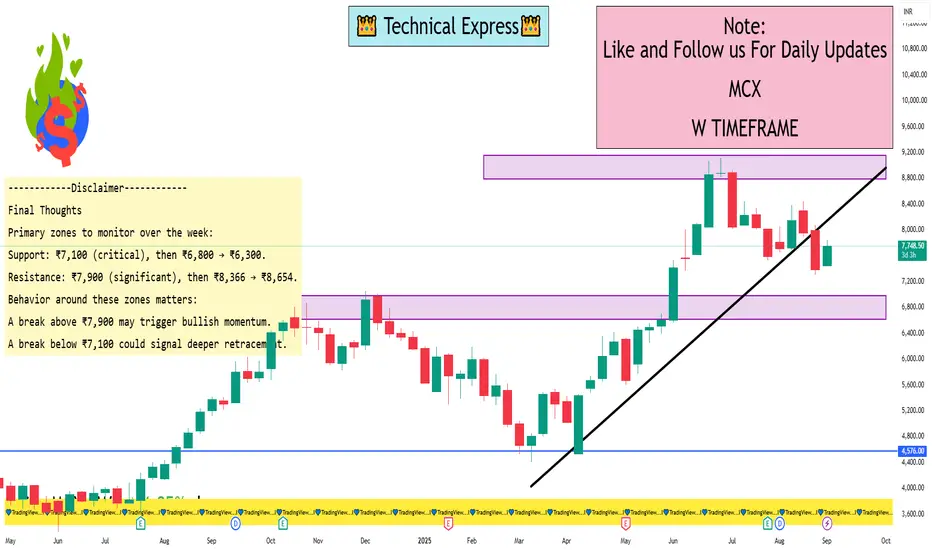
Multi Commodity Exchange of India Ltd 1 Week ViewWeekly Time-Frame: Key Levels (Pivot-Based)
Using weekly pivot-point analysis from TopStockResearch:
Resistance Levels:
R1 (Standard): ₹7,878.33
R2 (Standard): ₹8,366.67
R3 (Standard): ₹8,653.83
Pivot Point (PP): ₹7,591.17
Support Levels:
S1 (Standard): ₹7,102.83
S2 (Standard): ₹6,815.67
S3 (Standard): ₹6,327.33
This gives a broad weekly trading range: ₹6,327 – ₹8,654.
Weekly Outlook (EquityPandit as of Sept 1–5, 2025)
Immediate Support: ₹7,102.83
Immediate Resistance: ₹7,878.33
Secondary Support: ₹6,815.67
Secondary Resistance: ₹8,366.67
Extended Range (week’s extremes): ₹6,327.33 – ₹8,653.83
Intraday to Short-Term Levels (EquityPandit)
Support Zones: ₹7,548 – ₹7,302 – ₹7,166
Resistance Zones: ₹7,929 – ₹8,065 – ₹8,311
Interpretation & Strategy
Key Weekly Range: ₹7,100 – ₹7,900.
Holding above ₹7,100 indicates potential to rally toward ₹7,900–₹8,000, with further resistance toward ₹8,366–8,654.
A break below ₹7,100 could expose downside risk to ₹6,800, and possibly ₹6,300 if weakness intensifies.
Aggressive traders may watch:
Short-term range: ₹7,300–₹7,550 (support) vs ₹7,900–₹8,300 (resistance).
Pivot point note: Weekly pivots are derived from previous weeks’ price action using high, low, and close, and provide leading signals for potential reversal or breakout zones
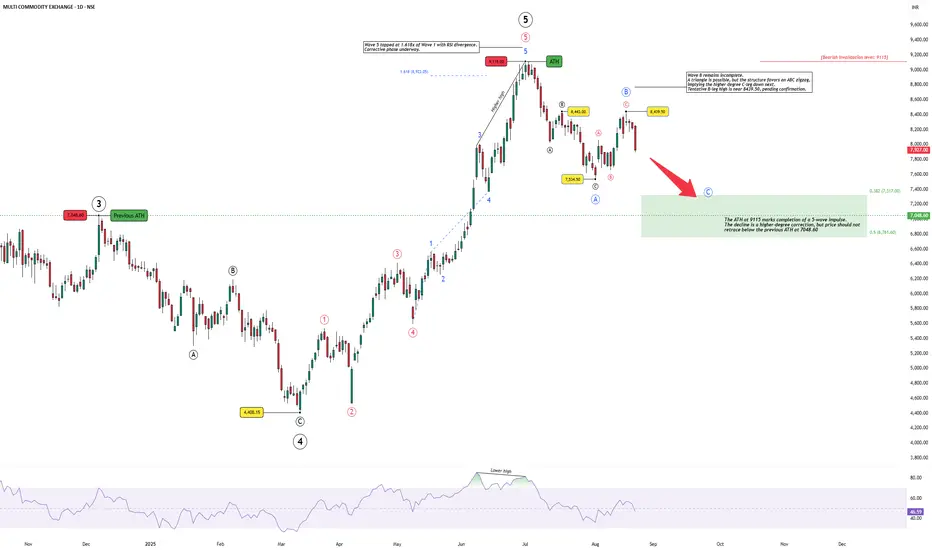
MCX: A Higher-Degree Correction Begins After Wave 5 TopThe rally in MCX reached its climax at 9115, which now marks the completion of a full 5-wave impulse sequence. Wave 5 stretched to 1.618x of Wave 1 and was accompanied by RSI divergence, a classic signal of exhaustion. This makes the top at 9115 significant, not just as an all-time high, but as the end of a higher-degree cycle.
From here, the market is unfolding into a higher-degree corrective phase. The immediate decline from the top appears corrective in nature, with an incomplete Wave B still in progress. While a triangle remains a possibility, the structure currently favors a simple ABC zigzag, implying that a C-leg down may follow.
The important level to watch is 7048.60, the previous ATH. Price should ideally hold above this zone to preserve the broader impulsive character of the rally. A sustained move below it would weaken the bullish outlook and raise the risk of a deeper correction.
At the same time, 9115 now serves as the bearish invalidation level. If price were to break above this peak, it would negate the current corrective view and open the possibility of a new bullish sequence unfolding.
In summary, the long-term uptrend has reached a natural pause. The near-term focus will be on how the correction develops — whether 7048.60 can provide support or whether the corrective leg extends deeper, with 9115 acting as the critical line in the sand for bearish continuation.
Disclaimer: This analysis is for educational purposes only and does not constitute investment advice. Please do your own research (DYOR) before making any trading decisions.
The Evening Doji StarMCX CMP 8048
Elliott - the v the wave of this swing is bigger than the third wave. This is the indication of a dramatic fall.
Candlestick pattern - the Evening Doji Star is a reversal pattern. Since this pattern is on the weekly charts the intermediate trend is down.
Fibs - The v th wave has halted at Fib ext.
Trendline - break of the trendline will further add to our take that the trend is weak and down.
Conclusion - book some profits.

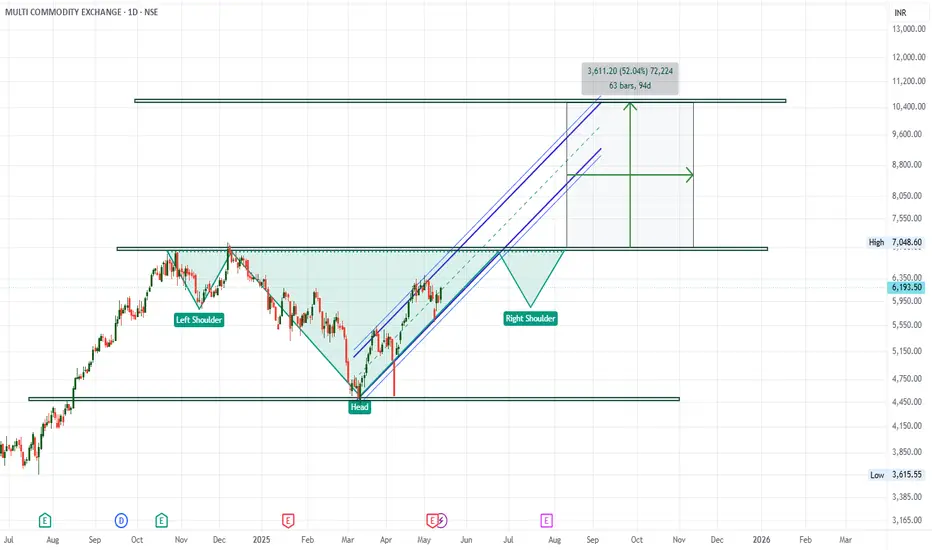
MCX getting Ready for Big 50% upmove in coming 10-12 Months.MCX getting Ready for Big 50% upmove in coming 10-12 Months.
On Daily charts we can see the Previous high of 6900 can be broken in 1-2 Months.
Post Consolidation around 6900 we can see MCX may complete H&S Pattern & Breakout above 7000 can push the stock towards 10000+ Zone.
LTP - 6190
Short Term targets - 6900
Long Term Target - 10000+
SL - 5650
Timeframe - 1-1.5 Years for 50% ROI
Happy Investing.
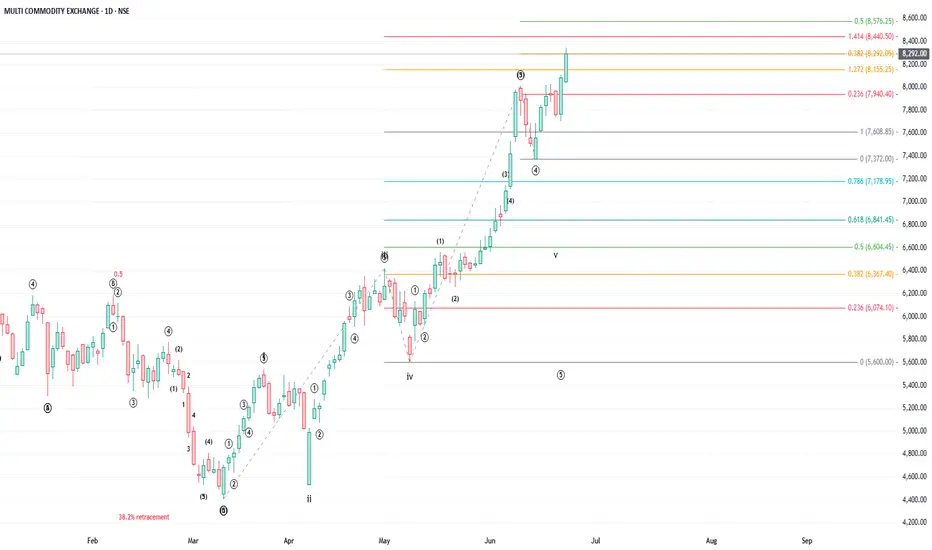
MCX 5th wave extension, final leg target 8860
MCX is in its 5th wave extension and the final leg of the current rally.
5th wave extensions typically end at 1.168 times of wave 0-iii to wave iv.
Buy with a target of 8860 with a stop loss of 8038.
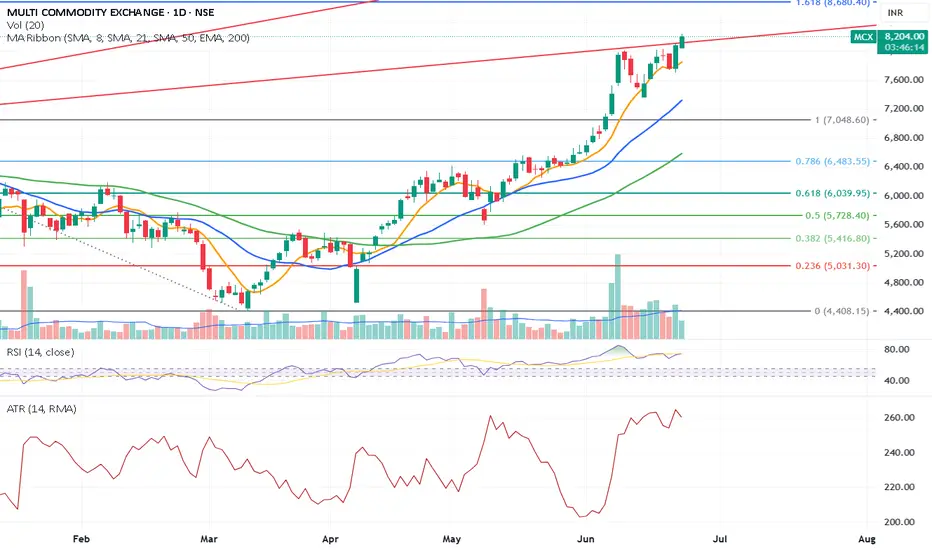
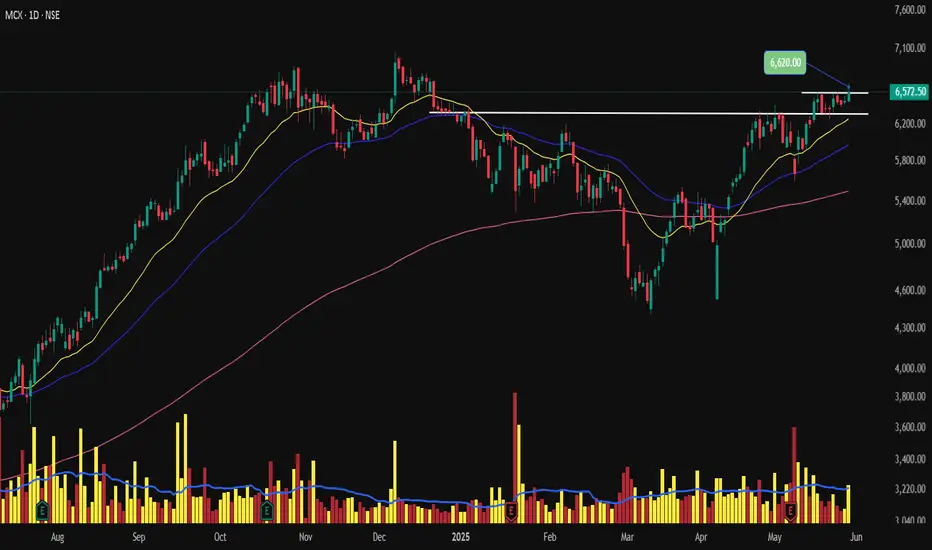
Trendline breakout in MCXMCX showing trendline breakout. If this continues tomorrow a confirmation will help the rally to continue.
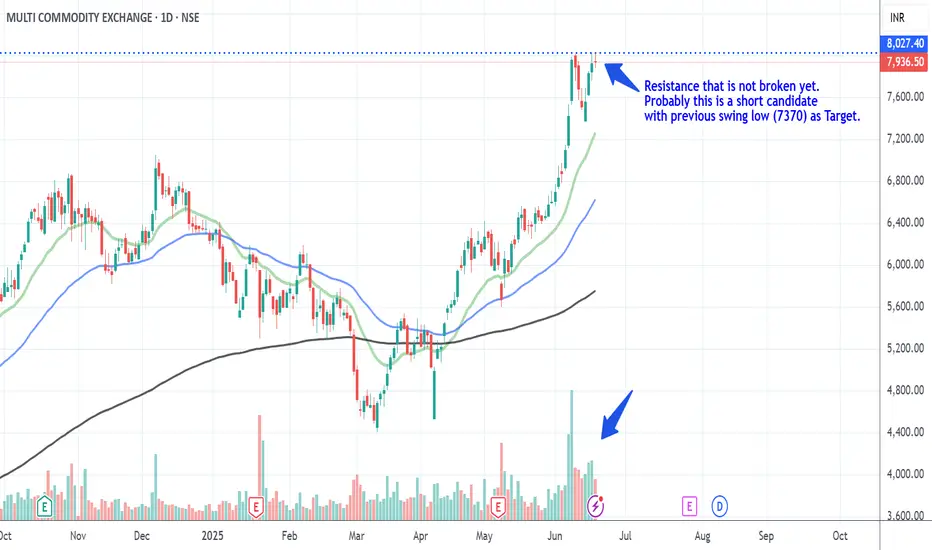
MCX_ShortResistance that is not broken yet.
Probably this is a short candidate with previous swing low (7370) as Target.
Wait for favorable entry. SL today's High.
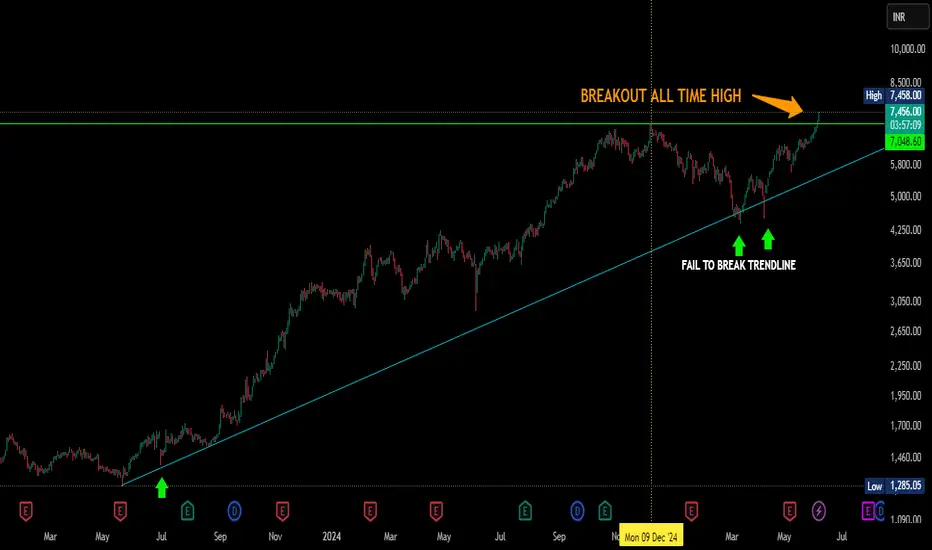
MCX AT ALL TME HIGHMCX is at all time high there is breakout and shining above 9 dec 24 high now tommorrow broken previous high and sustaining above all time high loking like it will go on new horizon.Chart shown here is day time frame.this is not my buy/sell call.
MCX BREEAKOUTMCX BREAKOUT...WATCH OUT for Rs.10000 levels next year or may be end of this year...who KNows!!

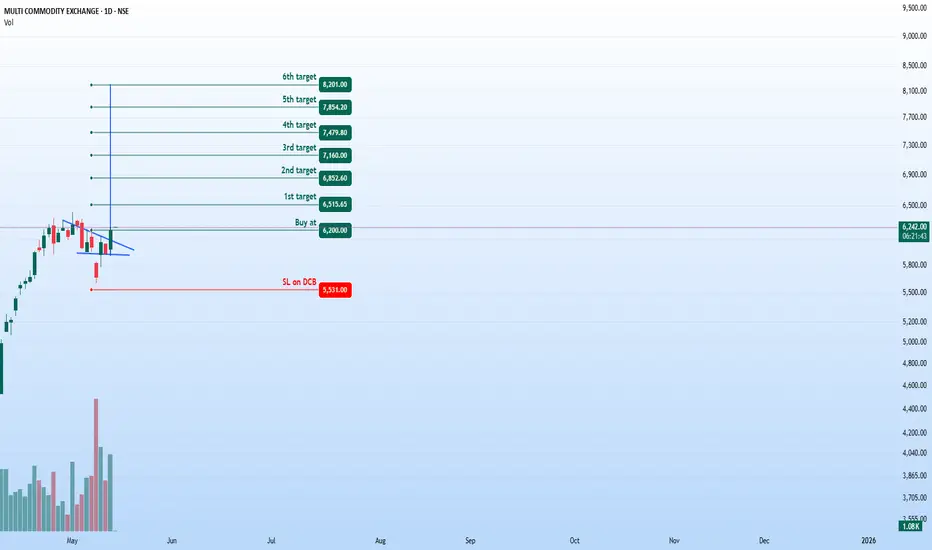
MCX - Bullish Breakout Opportunity (Daily Timeframe)Stock: MCX ( NSE:MCX )
Trend: Bullish Momentum Building 🚀
Risk-Reward Ratio: 1:3 (Favorable Setup)
Trade Parameters
🎯 Entry Zone: ₹6,200 (Breakout Confirmation)
🛑 Stop Loss: ₹5,531 (Daily Closing Basis) (~10.8% Risk)
🎯 Target Levels:
₹6,515.65
₹6,852.60
₹7,160.00
₹7,479.80
₹7,854.20
₹8,200 (Final Target)
Technical Rationale
✅ Bullish Flag Breakout - Price has broken out from consolidation pattern
✅ Strong Momentum - Daily & Weekly RSI >60 (Bullish territory)
✅ Volume Confirmation - Breakout volume 868K vs previous day's 571K (~52% increase)
✅ Technical Structure - Higher highs and higher lows formation
Key Observations
• The breakout comes with significantly higher volume
• Multiple targets allow for progressive profit booking
• Attractive 1:3 risk-reward ratio
• Strong technical structure supporting bullish case
Trade Management Strategy
• Consider partial profit booking at each target level
• Move stop loss to breakeven after Target 1 is achieved
• Trail stop loss to protect profits as price progresses
• Watch for volume confirmation on upside moves
Disclaimer ⚠️
This analysis is strictly for educational purposes and should not be construed as investment advice. Trading in financial markets involves substantial risk and is not suitable for all investors. Past performance is not indicative of future results. Always conduct your own thorough research and consult with a qualified financial advisor before making any investment decisions. The author assumes no responsibility for any trading losses that may occur from using this information.
What do you think? Are you watching this breakout on NSE:MCX ? Share your views in the comments!
Inverted H&S breakout with tight consolidation Inverted H&S breakout and then price tightness for 7 days and breaking out with high volume good setup for swing trade with SL 6355
MCX back on trackChart -> MCX Daily
Come back breakout!
CMP: 5581
Good Range to Buy: 5350 to 5550
Targets: 6100, 6440, 6870
SL: 5260 Daily Close
Disclaimer: This is for educational purposes only, not any recommendations to buy or sell. As I am not SEBI registered, please consult your financial advisor before taking any action.

An Exchange at a discount!!MCX CMP 5875
Elliott- Thats an expanded flat corrective pattern. The B leg gives a false breakout and then breaks down and closes way below the end of A wave. Here C is 1.618 of A.
Fibs- That it has halted at 50% from a higher swing is an indication that the trend is strong and intact.
RSI - the oscillator is above its bull zone. Hence the trend is intact.
MA- Its also at MA support.
Conclusion - the stock is down 16% from the highs and is a good buy for next six months to a year.

MCX longMCX took support at the long term strong base of 5500 ans is strying to reverse. Its staying above 5800 is a clear cut breakout for targets 6000/6150/6200 with stops at 5590

MCX on a toughest consolidation zone MCX showing some good support between 5400 and 5200; as per the earlier phase the MCX got a massive breakout at this area and moved swiftly, we can expect the same but the market condition is the key, and it can sustain for a while before getting into a beast mode. All the above conditions are valid only till the stock is not breaking 5217.
It will turn bearish below 5217 and it will head towards 4730 levels for support. Hoping the market should sustain at this levels and MCX should get some positive at this levels.
Tomorrow it can again try to come near the consolidated area where it should take support and move on the upside.
Key region to keep your eyes on MCX...


MCX and the EW CountsCMP: 6530
MCX is one of the best stocks I have come across in recent times to study/practise EW counts.
Such a wonderful set up with multiple sub-divisions playing out perfectly.
The chart published here is the 5 wave impulse from 2917 levels.
We are at the final 5th and this can either extend or terminate anytime depends on the market conditions. Since the 5th has gone past the 3rd wave high, technically, we can mark the 5 wave has ended here. The possible extension targets are marked in blue dotted lines.
Breakout of the falling trendline of the recent fall from 7050 would give us confirmation
If it breaks the 2-4 trendline (RED), then can safely assume that the uptrend has ended on this impulse.
Here is the chart on weekly TF
Here is the larger TF count for positional investment view
I am not a SEBI registered Analyst. Views are personal and for educational purpose only. Please consult your Financial Advisor for any investment decisions. Please consider my views only to get a different perspective (FOR or AGAINST your views). Please don't trade FNO based on my views.

MCX - Do you still want to chase FOMO?
CMP: 6920
TF: Daily
The current impulse from 2917.85 is on the fag end of the 5th move, and it could end/terminate anytime.
Divergence seen on daily, although another 5-10% move on the upside cant be ruled out.. But be sure if you want to chase the price at this level just because of the latest price action moves.
Just so can see, larger degree 5th is also in play now.. so, once this move is over, the pullback will be a bit deeper (retracing the entire move from 1140 level to 7K levels)
Waves 0-1-2-3-4 Path with internal counts
Investors - Trail your SL with tight SL
Traders - Dont jump, better to wait for the right opportunity (significant weakness followed by a bounce is the ideal time to go short)
I am not a SEBI registered Analyst. Views are personal and for educational purpose only. Please consult your Financial Advisor for any investment decisions.

Multi Commodity Exchange (MCX)MCX presents a compelling buy opportunity based on the formation of a Bottom Rounding Pattern, a bullish reversal signal indicating a transition from a downtrend to an uptrend. The stock has broken above the key resistance level of ₹6800 with strong volume, confirming the breakout. The height of the pattern suggests a long-term target of ₹9600, offering an upside potential of approximately 39%. For swing traders, an entry at ₹6920 or on a pullback to ₹6800, with a short-term target of ₹7200-₹7500 and a stop-loss at ₹6650, provides an excellent risk-reward ratio of ~1:10. Positional traders can aim for the full target of ₹9600, holding for 3-6 months. Volume spikes during the breakout further validate the pattern, while the strong support at ₹6800 minimizes downside risk. Despite potential market volatility, the technicals and breakout strength make MCX a strong buy candidate for both traders and long-term investors.
