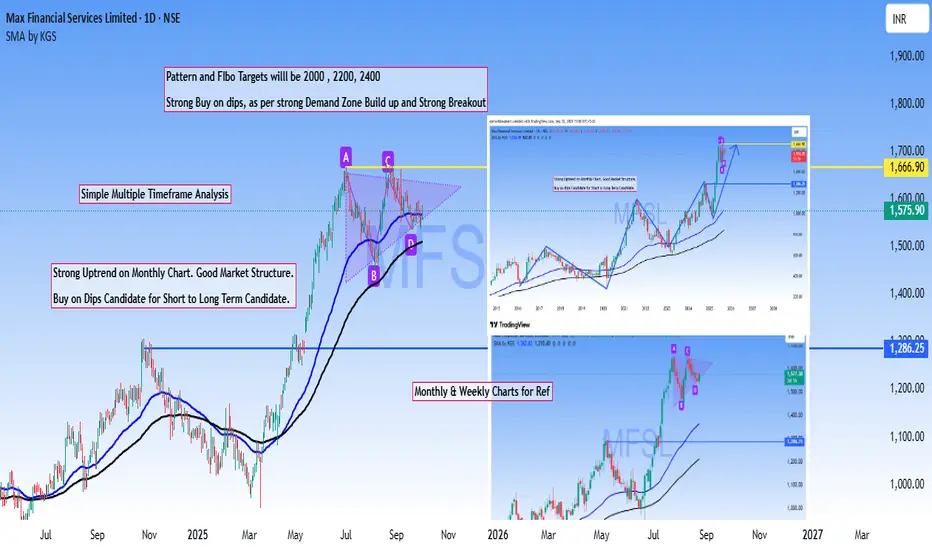
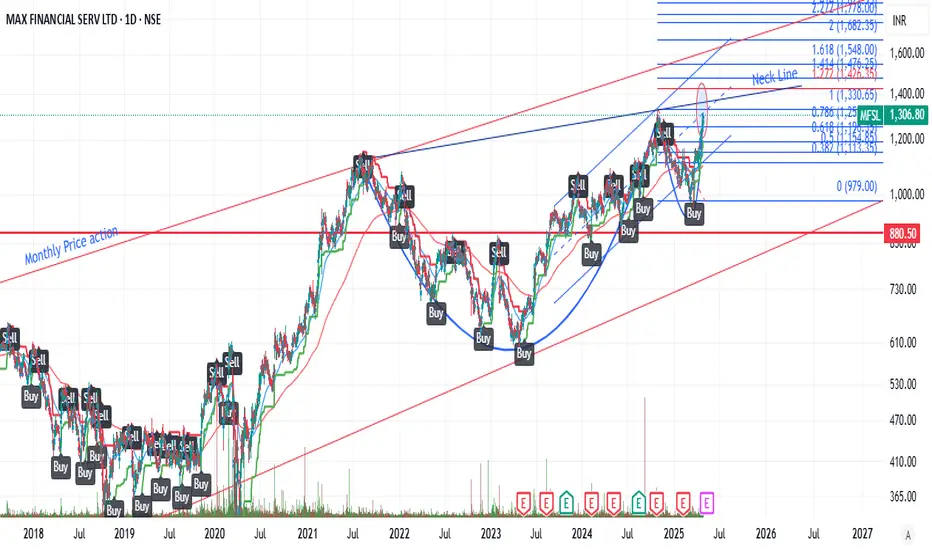
MFSL Multi time frame AnalysisMulti-timeframe confluence analysis offers traders a robust edge through straightforward yet highly effective methodology.
Based on that MFSL is a strong Buy on dips stock based on powerful breakout of previous ATH and the current market structure.
Targets are derived from #Pattern #breakout and #Fibonacci levels.
Bullish Pennant in formation.
Disclaimer: Above analysis shared for educational purpose only.
MFSL trade ideas
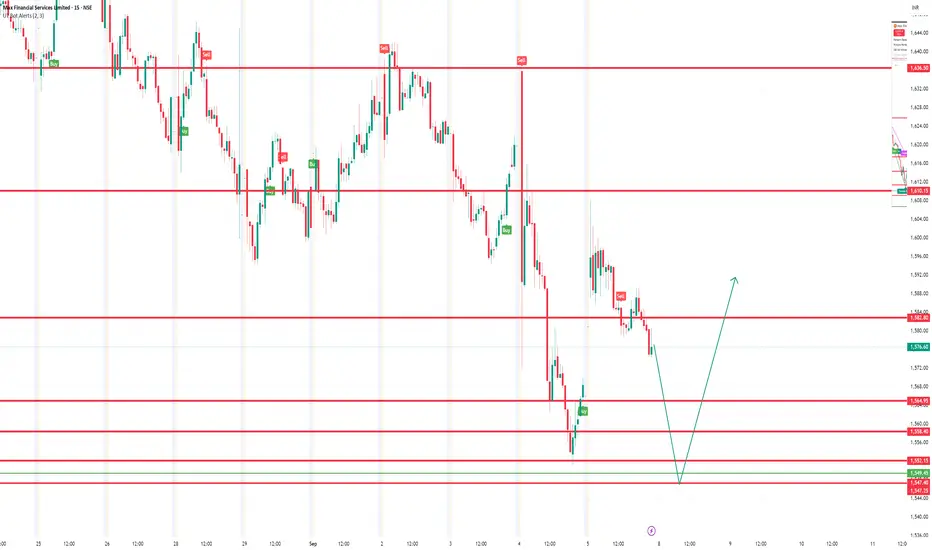
Max Financial- Liquidity Grab + Entry Levels on (5m/10m)On both the 5-min and 10-min timeframes, price is approaching key liquidity zones.
Here’s the breakdown:
🔹 Liquidity Pools:
Buyers trapped above ₹1,588 – ₹1,592 (supply zone marked in red).
Strong liquidity resting near ₹1,552 – ₹1,547 demand block.
🔹 Entry Levels:
Aggressive entry: Near ₹1,564 – ₹1,560 (demand touch).
Safer entry: Wait for liquidity sweep near ₹1,552 – ₹1,547 and confirmation.
🔹 Targets:
TP1: ₹1,576
TP2: ₹1,584
TP3: ₹1,592
⚠️ Bias: Short-term bullish retracement, but broader structure still under pressure. Manage risk with stops below ₹1,547.

max financial services stock has made its top for now it can retrace to 1500 levels. if option selling is done at 1640 ce with stoploss at 1620 in stock price can be good

Bearish divergence in MFSL after new ATHThe monthly chart signals a possible pullback in the MFSL price this month. Already a new all-time high is made, 1666.90
Immediate support to invalidate the fall will be 1579.50 to 1564.85 range, which also makes st target for the fall.
The other levels' downside are 1511, 1470 and 1376.50
If price bounces from the support range and closes above 1648, the bullish trend will continue for new higher highs.

MFSL - Will it be pushed/pumped beyond the channel top?CMP: 1501
TF: Daily
As you can see, Price is approaching the channel top and the momentum is slowing.
Given the vertical rally from 950 levels, I think it needs to cool off a before resuming the uptrend.
Other Observations:
Rounding Bottom pattern target seems to be achieved
Price is at the 1.618% fib extension of the recent swing high
A pullback is due/definitely on the cards.
I wouldn't short here.. but I wouldn't go long at this juncture
Disclaimer: I am not a SEBI registered Analyst and this is not a trading advise. Views are personal and for educational purpose only. Please consult your Financial Advisor for any investment decisions. Please consider my views only to get a different perspective (FOR or AGAINST your views). Please don't trade FNO based on my views. If you like my analysis and learnt something from it, please give a BOOST. Feel free to express your thoughts and questions in the comments section.

Stock selection is important in swing trade but not for Trading stock selection is crucial for swing trading as it determines the potential for capturing short- to medium-term price movements. For effective swing trading stock selection, focus on these key factors:
Liquidity: Choose stocks with high trading volume to ensure easy entry and exit.
Volatility: Stocks with moderate to high volatility (e.g., ATR > 2-3% of stock price) offer better price swings for profit potential.
Trend/Momentum: Identify stocks in a clear uptrend or downtrend using technical indicators like Moving Averages (5-day/20-day), RSI 50-60, or MACD. Stocks breaking out of consolidation patterns (e.g., triangles, flags) are ideal.
Catalysts: Look for stocks with upcoming events like earnings reports, product launches, or sector news that can drive price movement.
Sector Strength: Select stocks in strong sectors (e.g., tech, healthcare) using relative strength analysis or sector ETFs to confirm momentum.
Chart Patterns: Focus on stocks showing recognizable patterns like breakouts, pullbacks, or reversals on daily/weekly charts.
But you can Master in one Strategy for your trading setup
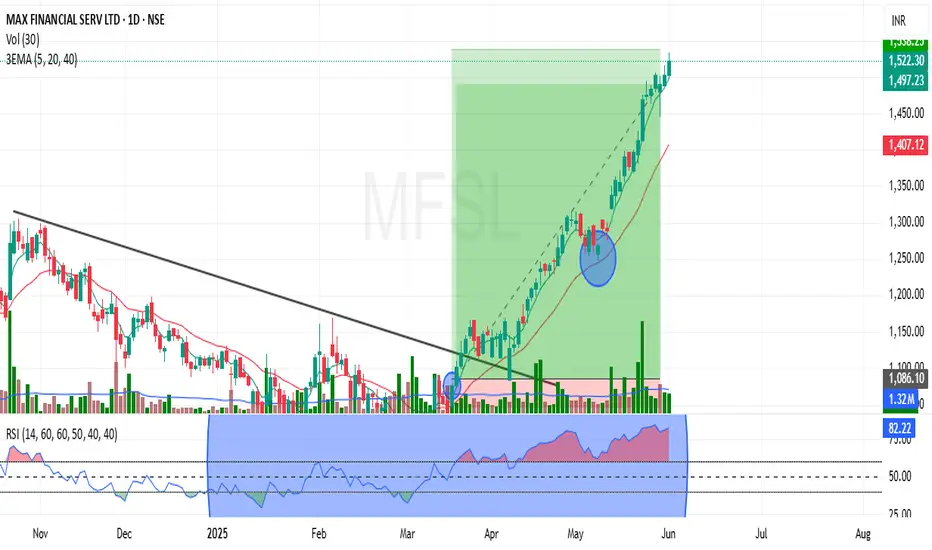
Master in One strategy :
After a long period of decline, when the stock candle crosses the 5EMA, this time, the RSI is above 50, and the momentum starts when it hits the 20-day Exponential moving average, which at that time has the RSI at 60 or above 60. This is a normal process in every stock (your Enter Point & same candle low is your stop lose) . You just check and confirm if I am wrong. And after this event, a good bounce is seen in that stock. And often this move is of a minimum of 10 to 15 percent. You will be surprised to know that this phenomenon is seen more than three times in stocks
MAX FINANCIAL SERVICES LTDHello & welcome to this analysis
The stock has entered the potential reversal zone (PRZ) in monthly time frame of double bearish harmonic patterns - ABCD & Deep Crab. The probable zone is between 1460 - 1500.
Since this is a monthly time frame pattern a bearish derivative trade would be risky as it could firstly take a lot of time to reverse after distribution and secondly the stop loss for the trade would be very high since the range is big.
This signal should be initially be taken as an alert not to attempt a fresh long at the current level and wait for some weekly to daily time frame weak signals to take a short trade if it reverses for 1300-1200.
The pattern would become invalid above 1600. The acceleration for downside would happen once it starts sustaining below 1400 (as of now), this will keep changing week on week till the pattern is valid.

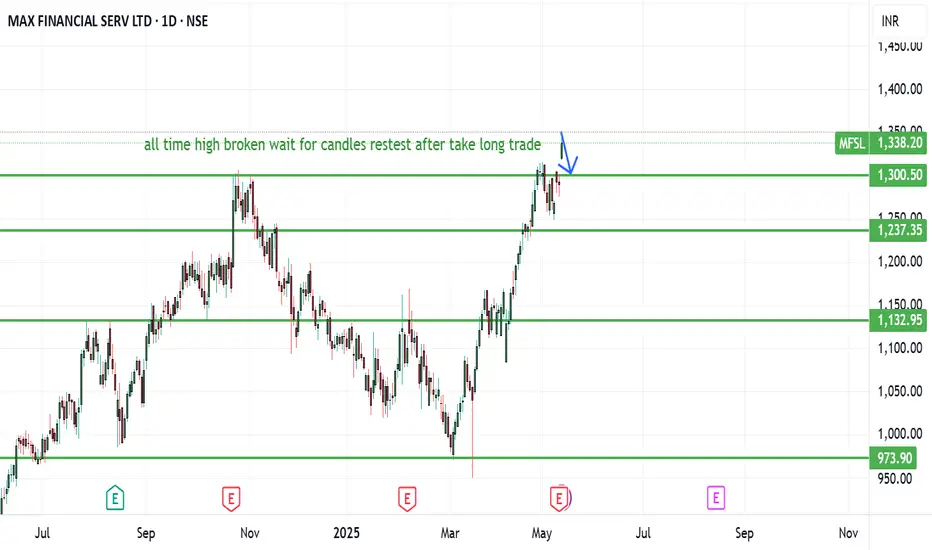
MAX FINANCIAL SERVICES - LONG TRADE SETUP FOR SWING TRADINGCURRENTY MFSL TRADE ALL TIME HIGH WAIT FOR RETEST AFTER TAKING TRADE.
TAKE GOOD RISK REWARD
All these illustrations are only for learning and sharing purposes, not a trading recommendation. It is only for paper trading. ALL THE BEST GUYS...
Max Financial - Positional Short SetupCMP 1305 on 02.05.25
In the last 2 months, the stock price has increased by around 30%. This time forming a double top-like pattern. If the price is rejected from these levels, a bearish move may come ahead.
If the price remains below the 1300 levels, targets of 1245/1210 and 1165 may be seen.
One should wait for the confirmation for a short setup, while considering risk management.
The setup fails if the price sustains above 1330.
All these illustrations are only for learning and sharing purposes, not a trading recommendation. It is only for paper trading.
All the best.

MAX FINANCIAL SERVICES LTDAs of May 1, 2025, at 9:35 AM IST, here are the key daily support and resistance levels for Max Financial Services Ltd. (NSE: MFSL) based on recent technical analysis:
🔹 Support Levels
S3: ₹1,011.58
S2: ₹1,020.37
S1: ₹1,030.43
🔹 Resistance Levels
R1: ₹1,049.28
R2: ₹1,058.07
R3: ₹1,068.13
These levels are derived from the Classic pivot point method, calculated based on the price range of the previous trading day.
📊 Technical Indicators
RSI (14): 50.14 (Neutral)
MACD: 1.57 (Sell)
ADX (14): 22.20 (Neutral)
Williams %R: -51.44 (Buy)
CCI (14): 68.41 (Neutral)
ROC: 3.45 (Buy)
These indicators suggest a neutral to slightly bullish trend, with the stock trading near its 20-day moving average and showing mixed momentum signals.
📈 Moving Averages
20-day EMA: ₹1,073.42
50-day EMA: ₹1,109.36
100-day EMA: ₹1,118.91
200-day EMA: ₹1,086.00
The stock is trading below its 50-day and 100-day EMAs, indicating a potential resistance zone around ₹1,109.36.
Note: These levels and indicators are based on historical data and are subject to change with market conditions. It's advisable to monitor the stock's price movements and consult with a financial advisor before making any trading decisions.

MFSL - Cup and Handle formation - Ready to flyFollowing are the reasons for caption.
1) Cup and Handle formation about to complete.
2) Fibonacci sequence target marked tat 127 %
3) ADX > 25
4) The price action has entered the parallel channel
5) Super trend crossed over from 50 DMA from bottom.
The study is for academic purpose and not a recommendation to invest.
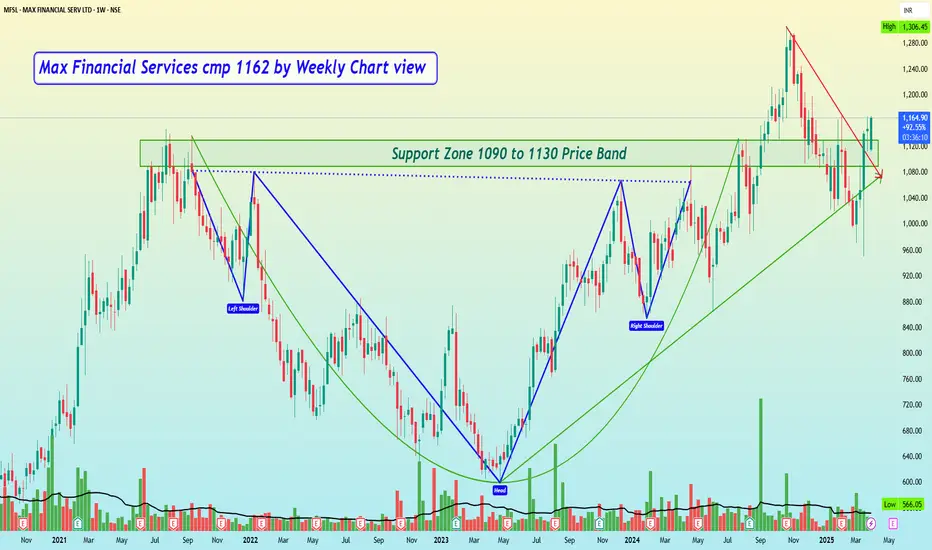
Max Financial Services cmp 1162 by Weekly Chart viewMax Financial Services cmp 1162 by Weekly Chart view
- Support Zone 1090 to 1130 Price Band
- Resistance Zone 1200 to 1245 Price Band
- Volumes getting in close sync with average traded quantity indicating demand based buying
- Price respecting Rising Support Trendline and sustaining Breakout above Falling Resistance Trendline
- Support is going thru the test and retesting phase with a faint breakout in the making process seen clearly
- Multiple intertwined Bullish Patterns of Rounding Bottom, Cup & Handle, Head & Shoulders, as one may observe and interpret
Max Financial Services Ltd – Trend Reversal in Play?🚀 Technical Analysis Breakdown:
The yellow trendline shows a long-term support, which has held well despite recent corrections.
The red downtrend line indicates a recent bearish phase, which has now been broken with a strong bullish candle.
The stock has bounced from the trendline support, showing signs of strength.
Above all the strong Pinbar candle looks amazing for a candle close .
🔎 Your Take? Do you see further upside or a pullback? Comment below! 👇

Max Financial - Low Risk SetupCMP 1032 on 20.02.25
It is clear from the chart that the stock price has been rising in a parallel channel in recent sessions. Right now it is at the bottom of the channel.
If gives a bounceback, may go into a bullish phase again.
The risk-reward ratio seems good at the moment.
The setup remains active when the price sustains inside the parallel channel.
Plz keep the position size according to the risk management.
All the above illustration is my own view. Shared only for learning purposes. It is not a trading recommendation in any form.
All the best.

MFSL - Looks ready to finally bounceStock has broken the trend line with excellent candle making a fresh demand zone area of 1070-80
It also contains a lower strong zone at 1020-30
Chart suggests to bounce from current levels
If happens it may try to reach near its first target area of 1190 - 1200
As market seems too volatile, take confirmation on lower time frame before opening a new positions, also trade with strict stop loss

MFSL - WolfeWave is activeCMP: 1115
The visible target is sub 900 levels.. lets see if the market acts as per the WW set up on this.
I have recently published a similar IDEA on HAL

VIEW ON MFSLBreakout on the stock
But buy only above 1240
Target 1300
Stop loss 1210
I am just representing my views
For educational purpose only.

MFSL Short Term TradeThe stock has been in an overall uptrend since five months
It has also shown higher highs and higher lows since then
Currently, a rising wedge pattern breakout is visible on the chart
On the breakout, a rise is visible in the volume and atr
Thus, there is a short term trade
tgt 1354, sl 1220

MFSL Major Breakout with Volume Surging NSE:MFSL Breaking Out Major Levels with Big Volume Surge on Hourly TF.
Trade Plan:
Entry: On Retracement Near 20 EMA or Breakout of Swing High 1300.
Stop Loss: Entry Candle Low.
No Trade: if Below 1200.
🙋♀️🙋♂️If you have any questions about this stock, feel free to reach out to me.
📍📌Thank you for exploring my idea! I hope you found it valuable.
🙏FLLOW for more
👍BOOST if useful
✍️COMMENT Below your views.
Meanwhile, Check out my other stock ideas below until this trade gets activated. I would love your feedback.
Disclaimer: This analysis is intended solely for informational and educational purposes and should not be interpreted as financial advice. It is advisable to consult a qualified financial advisor or conduct thorough research before making investment decisions.

Tight Range Breakout | MFSLFor Education Purpose only!!!!
**MFSL stock is already up by 3%, but it’s holding up well in this falling market. I'm charting this stock just for my own perspective and clarity, though I may not be 100% accurate.**
FIIs are playing their old trick:
1️⃣ Push prices down 📉
2️⃣ Buy cheap stocks 💰
3️⃣ Wait for rate cuts 📊
4️⃣ Profit big in the next bull run! 🚀
Retail investors, don’t fall for the fear!
✅Stay invested—smart money knows a bull run is coming!
News has circulated about the index predicting a target of 24,000 for Nifty and 50,500 for Bank Nifty. The price has already been quoted in the reports.
⭕️ Swing Trading opportunity: Price Action Analysis Alert !!!⭕️
💡FNO Stocks Trading📉📈📊
✅Check out my TradingView profile to see how we analyze charts and execute trades.
💡✍️Applied Tools:-
✅Strong Chart Pattern Breakout
✅Channel Pattern
✅Range Breakout
✅Resistance becomes support
🙋♀️🙋♂️If you have any questions about this stock, feel free to reach out to me.
📍📌Thank you for exploring our idea! We hope you found it valuable.
🙏FLLOW for more !
👍LIKE if useful !
✍️COMMENT Below your view !

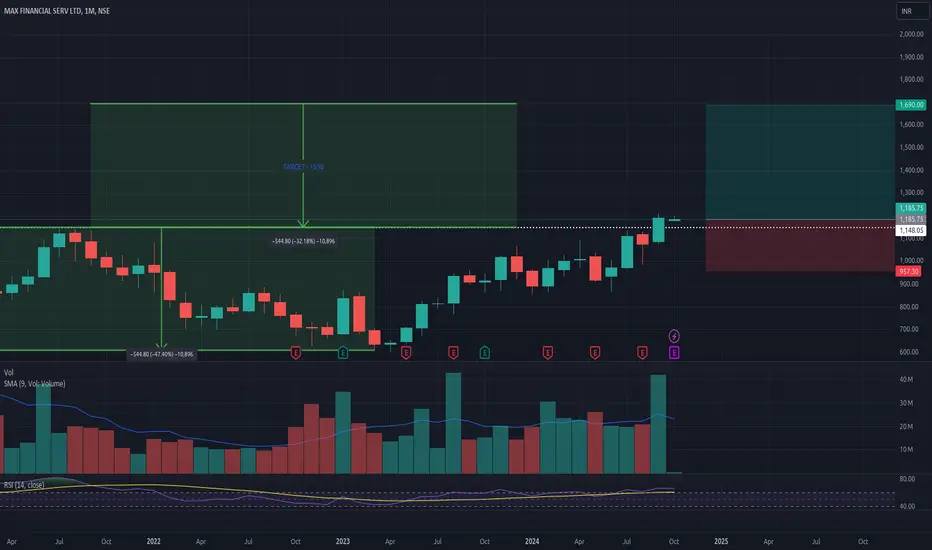
MFSL: Multi-Year Breakout: Monthly Timeframe: Oct 24MFSL: Multi-Year Breakout: Monthly Timeframe: Oct 24
Stock broke the high it made in Jul'21 in Sep'24. A multi-year breakout on a monthly time frame
RSI is just above 60 - Indicating good buy demand
Breakout in Sep happened with above average trade volume (9 SMA)
Entry and y'day 01-Oct close @ 1185.75
Target = Breakout level + Drawdown during consolidation phase = 1148 + 545 ~ 1690
Stop Loss = 1 ATR below previous month's low = 957.3
MFSL looking good on a monthly timeframeMFSL has given a breakout at 1150 on a weekly timeframe. Upside potential: 30-40%. Stop loss: 1120. This is not a buy/sell recommendation. Research carefully and invest at your own risk
