Max FinancialNice consolidation tried breaking out now close becomes close or second half should sustain above that level for long
MFSL trade ideas

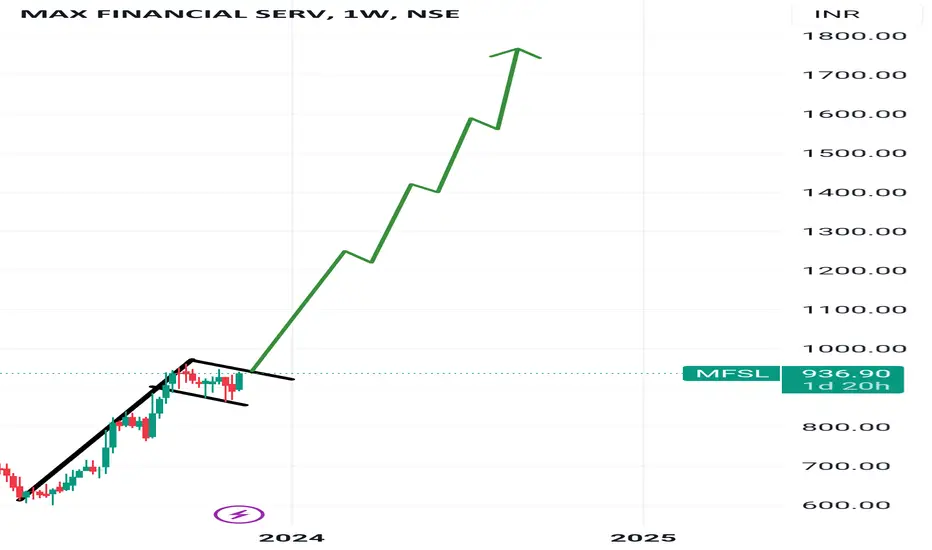
Breakout Attempt in progress📌#Breakout Attempt in progress
MFSL
+ A tight Squeeze at the resistance
+ Volume spike in Smaller TF
+ Trading above Key EMAs

Breakout after 3 months consolidation.Expecting 8-10% rally from Breakout point. Can see volume increasing, it will be great catch in November month

MFSL Formed pole & flag pattern.
Industry and Business: Max Financial Services operates in the life insurance industry, providing various life insurance products and services.
Trading at 936,nearest Resistance is 966,keep SL at 856.
Target
1249
1419
1592
1757
risky buytargeting rate 910-912
buy entry triggered based on my ichimoku study
bit of risky trade
disclaimer = trade @ own risk

Positional or Longterm Opportunity in MFSLGo Long above 642.8 for Targets of 686.5, 730.2, 773.9, and 817.6 with SL 599.1
Reasons to go Long:
1. On a Weekly timeframe if we draw the Fibonacci retracement tool from the all-time swing low (point A) to the all-time swing high (point B) then we see stock took support from the 0.618 Fibonacci level.
2. Also a bullish candlestick pattern Bullish Hammer (marked with orange color) is formed around 0.618 Fibonacci level.
3. In addition to this there is a strong demand zone (marked with purple color), from which the stock initially faced resistance but now is taking support and moving up.
4. Lastly our final target is just below the resistance zone (marked with red color).

MFSL Simple Price Action Analysis NSE:MFSL
Company Overview
Max Financial Services Ltd. operates as a holding company. The firm engages in the provision of advisory services. It operates through the following segments: Business Investments and Life Insurance. The Business Investments segment deals with treasury investments. The Life Insurance segment offers private life insurance products and services. The company was founded by Analjit Singh on February 24, 1988, and is headquartered in Noida, India.
Technical analysis
1. Flag Breakout + Horizontal Resistance Breakout
2. Forming 2nd Swing High Which Has a Higher Probability Of Trend continuation.
3. Price is trading above 200 Ema
4. Entry Logic
5. Target forecasting.
hope you found this helpful.
Please comment your views.
Keep Learning,
Happy Trading!


MFSL
Prices eroded 48% from its all time high of 1148.
Price has bounced from 61.8% FR level support and Monthly RSI is also resting on its Oversold levels.
Past price behavior suggests that a move to 940 (61.8% FR level resistance) is likely.
Bullish outlook remains valid as long as price sustains 600.

MFSL - sellsell near 960
tg1 - 940
tg2 - 925
tg3 - 900
sl - yours
Disclaimer : This is my personal analysis for study purpose not intended for trading.

MFSL - Perfect bullish chart patternWe are looking weekly chart at this moment. MFSL is looking promising for the upside at the current level. First, the Stock has given the breakout of the long bearish trend line, and after it has given the break-out of the resistance zone. The chart structure is good, keep an eye on it.
Disclaimer - I am not a SEBI-registered technical analyst and advisor so contact your financial advisor and make a self-decision. I will not be responsible for any profit or loss.

MFSL @ 872 TGT above 1020 After a considerable consolidation stock has again started moving north.
Keep learning and stay invested.

Max Financial Services Bullish Set UpAmazing opportunity to be part of this stock journey
Small stop loss set up
Amazing Volumes looks promising in this market
Stop loss of 750
Multiple Targets with quick gains
Target 1: 940
Target 2: 1040
Target 3: 1100

MFSL- Wait for the tops to be broken for Long.
MFSL has broken out of the clutches of black line and but made triple top marked with "Red Diamonds at 882. it closed in positive territory, at the close of last working day at 842 lowest of the three red lines market. However, didn't breach middle and Upper most red line Marked with RED Diamonds. Don't long unless these tops are broken at 855.5 and 882.55. Let it bounce back from green trend line and then only expect higher moves.
Please check Author's previous analysis on MFSL which is being attached.

Entry only above 860This might become a probable winner provided it can sustain above 860 price level firmly. Above resistance levels are marked in blue, while stoploss can be considered as the redline.
--- --- ---
"There are only two primary ways we make money trading;
catching a big price move with a small position or having a large position and catching a small move."
- Bill Meehan

MFSL- Complete analysis - Triangle formed at 1H Chart
Author uses Gann, Fibonacci and Wave Analysis along with his unique indicator which makes Price- Time and Volume Analysis very easy.
Please refer to above Daily and IH charts of MFSL.
Note: Do not refer to the chart with black back ground. Only charts with white back lines to be referred.
1. Red Line is the trend line drawn from the beginning of Wave 1, Low of Wave 2 and Low of Wave 4.
2. After taking support at Intersection of Red and Green LIne, Price has moved for Wave 5.
3. Personalized and amazing indicator of the Author shows that it is taking support at 45 degree level of 803..2.
5. Since Cycle of 5 waves is complete, it is likely to make ABC Waves in the opposite Direction.
6. Watch candles of last two days. Candle of Thursday is Green but that of Friday is red, no doubt it has crossed above low of green candle but did not engulfed it.
7. Please wait to buy at redline only.
8. Now. refer to one hour chart attached, Three candles of one hour chart are making trend lines but green line above is hurdle. Marked are two Black parallel lines, providing hourly support.
9. If black support lines are broken, price may retrace till red line. completing ABC Waves.
10. watch the volume bars now, huge green volume bar at the top of the price. Means, all the shares have been sold by smart money.
10. Moreover inverted Head & Shoulder pattern has also been formed in 5 minutes chart but that is not very relevant.
Conclusion: Price is most likely to trace back to the red trend line and then to up.
Disclaimer: Content has been created only for educational purpose and there is no recommendation, o BUY of SELL. The Author is not a SEBI Registered Analyst. please consult your financial advisor before making any decision.
Happy to share. Let's grow together.

MFSLBullish Pole and Flag BO with good volumes
MFSL
Buy above 887
SL below 814.5 (8%)
Short term targets: 911, 952, 994 (12% +)
Mid term targets: 1039, 1079, 1151
++ Educational purpose only ++

BUY MFSLMFSL is a strong BUY due to following reasons-
Flag breakout and retest
5,13,26 EMA Crossovers
Possible Cup and Handle breakout

Max Finance can go up to 940 SL 800 As per Harmonic PRZ pattern, Max Finance can go up to 940 SL 800

Looks good to me in short term as well as in long termStock has touched its resistance multiple time in long run, and in short term it has given breakout the cup & handle pattern also. Analyze by yourself before investing.

Buy- good breakout with volumeBuy- good breakout with volume
weekly breakout with volume
all moving averages in support

MAX FINSERV - BULLISH FLAG BREAKOUT...BUY - MAX FINANCIAL SERVICES
CMP - Rs. 738
Target - 1: Rs. 934
Target - 2: Rs. 1124
.
.
Technicals - Bullish Flag BO
.
This is just a view by an expert analyst, please invest at your own risk.
.
Follow me for more!

mfsl - buy on dipsBuy from cmp to 803
easy tg - 820
tg2 - 832
sl close below 803
Disclaimer : This is my personal analysis for study purpose not intended for trading.
