MGL BULLISHMgl looks good bullish on weekly chart after breaking a down trend line resistance of triangle and close above on weekly basis so we can expect a target of 1000 in it in coming days from here.
MGL trade ideas

[Intraday] MGL Buy IdeaNote -
One of the best forms of Price Action is to not try to predict at all. Instead of that, ACT on the price. So, this chart tells at "where" to act in "what direction. Unless it triggers, like, let's say the candle doesn't break the level which says "Buy if it breaks", You should not buy at all.
=======
I use shorthands for my trades.
"Positional" - means You can carry these positions and I do not see sharp volatility ahead. (I tally upcoming events and many small kinds of stuff to my own tiny capacity.)
"Intraday" -means You must close this position at any cost by the end of the day.
"Theta" , "Bounce" , "3BB" or "Entropy" - My own systems.
=======
I won't personally follow any rules. If I "think" (It is never gut feel. It is always some reason.) the trade is wrong, I may take reverse trade. I may carry forward an intraday position. What is meant here - You shouldn't follow me because I may miss updating. You should follow the system I share.
=======
Like -
Always follow a stop loss.
In the case of Intraday trades, it is mostly the "Day's High".
In the case of Positional trades, it is mostly the previous swings.
I do not use Stop Loss most of the time. But I manage my risk with options as I do most of the trades using derivatives.
=======

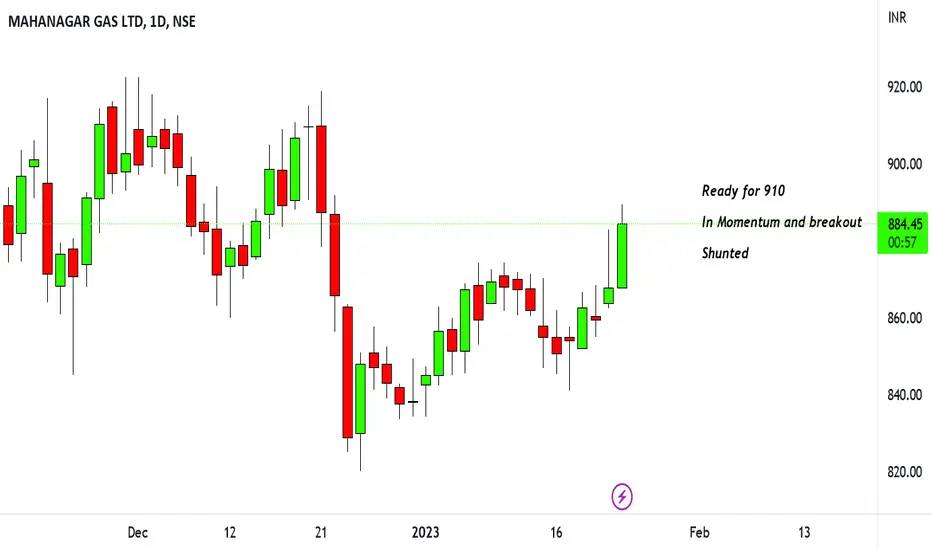
Mahanagar Gas LtdMGL is moving in broad range. Monthly price is above 50 EMA. In weekly and Daily time frame price is in momentum. Hence buy on dips is ideal strategy.
Weekly MACD positive crossover stat.
Weekly RSI is in momentum
Daily RSI is in momentum

#Educational#Gas&Petroleum#MGL-LongBreakout stock with volumes.
Expected targets would be 1100/1150.

A successful Breakout Seen in MGLIn the case of MGL stock, if there is a confirmed breakout from the ascending triangle pattern, it could indicate that there is a strong likelihood of further upward momentum in the stock. However, it is important to note that technical analysis is just one tool in the decision-making process for investing in stocks, and it should always be combined with fundamental analysis and a thorough understanding of the company's financial health and industry trends. Additionally, it is important to manage risk by setting appropriate stop-loss levels and position sizes.


MGL - Triangle pattern breakout - 10% upside potentialMGL has given triangle pattern breakout at 925 levels.
Target is coming to 1060-1070 range (may come in 5 - 10 days)
SL: Hrly candle close below 925 levels.
Note: Looks good for long term hold as well, as the move seems to be a trend reversal.


MGLMGL taking rejection from resistance and also forming a ascending flag pattern on daily TF.
Only for educational purposes


MGL : STOCK FOR INTRADAYHere comes another Stock for Day Trading for 17 Feb 2023. The Chart is breaking out Ascending Channel @ 920.85. In hourly Time frame, it is already showing price action at this level. Thus, signaling that we may have a new support @ 920.10. Thus, we may see a breakout with new targets as 975 and 1065. Entry Level is 933 not before that , with a small SL of 915.
Please Boost my study and motivate me, so that I can bring more ideas to you.

MGLMGL:- Rounding bottom pattern is formed, stock is about to give breakout after 1 and half year, if breakout occurs then we can see upside movement, till then keep your eye on stock
Hello traders,
As always, simple and neat charts so everyone can understand and not make it too complicated.
rest details mentioned in the chart.
will be posting more such ideas like this. Until that, like share and follow :)
check my other ideas to get to know about all the successful trades based on price action.
Thanks,
Ajay.
keep learning and keep earning.

MGLHi guys, In this chart i Drew My Best Levels in MGL for Short, Observed these Levels based on price action and Demand & Supply. Don't Take any trades based on this chart/Post...because this chart is for educational purpose only not for Buy or Sell Recommendation.. Thank Q


MGLIn Weekly chart of IGL, we can see multiple rejection at 900-910 level.
upward momentum is expected in coming weeks once it crosses the above level.
Enter with SL for a target of 1020-1040.


MGL CHART ANYLYSISMgl At Daily Time Frame Stuck on Resistance which is previously acted as Major Support
If 15Min Candle can Break This Resistance and Hold To Support Will See The Big Trend In Next Session,

swing trade for short termyou can enter in this trade or you can wait for retest . target 900
time frame : 30min
follow your risk management and RRR

Channel pattern breakdown in MGLMGL
Key highlights: 💡⚡
📊On 1h Time Frame Stock Showing Breakdown of channel Pattern .
📊 Strong bearish Candlestick Form on this timeframe.
📊It can give movement up to the Breakdown target of below 805-.
📊Can Go Long in this stock by placing a stop loss above 872+.
📊 breakdown this can give risk:reward upto 1:7+

MGL Breakout above 926Mahanagar gas is good for going long above 926 with a stop of 900 for the targets of 950/990
915-925 is a resistance zone on charts breakout of this zone will move the price higher .
