MGL MGL is close to its investment levels, price might fall a bit may be close to 800-810 and then could give a good rise, so accumulate this stock at current price or lower with SL 750 for a target of 950-1000 in coming weeks.
MGL trade ideas


MGL SHORTDo initiate trade based on 5min candle close!
Levels mentioned on chart.
Trade at your own risk!
Thumb's up if you like the idea and do follow for more ideas!


MGL INTRADAY DEC 15THself explanatory chart.
trend line breakout.
levels for buy and sell given on the chart.
just typing cos otherwise it's not letting me publish.
thank you very much.


MGL is at a crucial point with multiple signs of movementMGL is at a crucial point with multiple signs of movement and we are tracking a little ahead, hence it can go up or down basing on the next candlesticks
Reasons/Traits :
• 20 EMA crossing 50 EMA from below
• Daily trend is at resistance/supply zone
• Inverted head and shoulder formation can be seen (Chances of going up)
• Descending Broadening Wedge pattern can also be seen (Chances of going up/can be failure)
• Last two daily candle stocks shows Dark Cloud Cover Pattern (Chances of going down)
• Volume is constant, ADX is below 25 (weak trend) and RSI is ascending and currently at 60
• Last daily candle retraced till 0.236 fib levels, if in uptrend, this retracement can lead to a sharp up move
What can happen next :
Scenario 1 : Above 1200 can go up to 1285 levels with a retest of the 1200 supply zone levels
Scenario 2 : Below 1200 can retest 0.236/0.5/0.618 fib levels and can go till the supply zone of 1080
In both the scenarios, a retest is required at supply zone to follow respective trend. Let’s see..
Disclaimer : This analysis is only for educational purpose and not be considered as any trading idea/tip. Please consult your financial advisor before you take any trade and we are no way responsible for your profits/losses. Thank you!

Buying zoneExpecting the price to find support around these levels. To be followed by either by Consolidation or Uptrend Swing.
Disclaimer: View for Education Purpose only, not for trading suggestion.

MGL may be BullishMGL makes a Bullish Divergence
Two possibilities shown in the chart
Reversal can expect immediately

MGL Bullish positive reversal with supertrend & RSI(EDU purpose)Bullish Treditional Reversal Divergence.And waiting for positive supertrend.

📊 Mahanagar Gas LTD 🎯NSE:MGL
Safe levels To go long on Mahanagar Gas LTD ( MGL ) is still quite far it mas reverse from current levels as well but enter from safe levels is always good.
******whatever charts or levels sharing here or on any other platforms are just for educational purpose only, Not A Recommendation To Buy Or Sell. Please do your own analysis before taking any trade on them. We are not SEBI registered.

MGL short sellTrade based:
Overall it was sell trend.
during the sell trend. in inside the hr tf. form a bounce back and also it broken.
so, its a best time to enter for sell.

gfdsssssssssssssssssssssssssssssssssssssssssssssssssssssssssssssssssssssssssssssssssssssssssssssssssssss

Swing Opportunity in Mahanagar Gas LtdGo Long above 1013.3 for Targets of 1063.1, and 1112.9 with SL 963.5
Reasons to go Long :
1. On a daily timeframe if we draw the Fibonacci retracement tool from recent swing low (point A) to recent swing high (point B) then we see stock took support from 0.618 Fibonacci level.
2. A bullish chart pattern, Double Bottom (W pattern) is formed around 0.618 Fibonacci level.
3. Also there is a strong demand zone (marked with purple color), from which the stock initially faced resistance but now is taking support and moving up.
4. The stock may go up to the trendline (marked with red color) where it may face resistance.

Question on MGLIn ST stock has given a breakout of a triangle.
Staying above 1020 some trending moves may come.

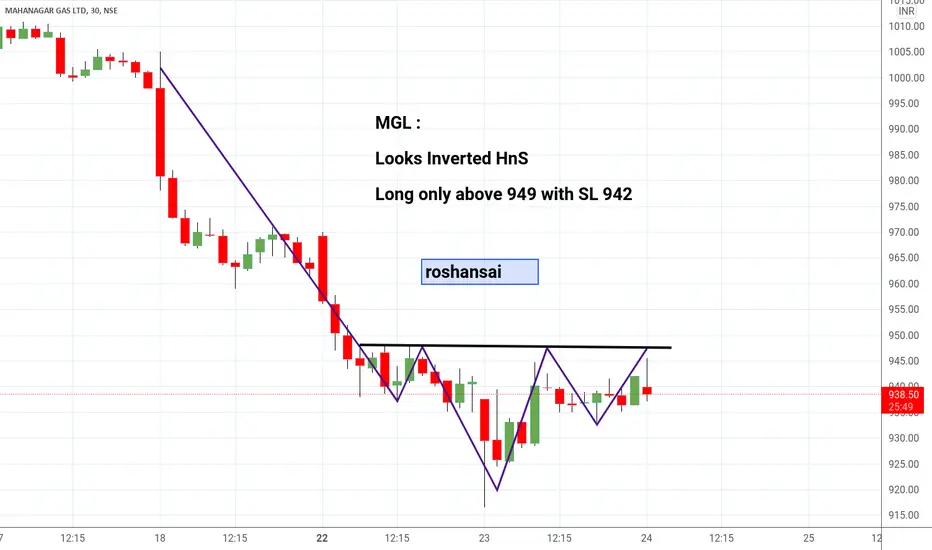
MGL - Intraday ViewMGL :
Symmetric triangle in progress
Intraday Looks good for breakout
Long above 1023 with SL 1017

MGL Previous gap up zone 950 to 975 expected to act as supportAs per the daily chart the previous gap up zone of 950 to 975 expected to act as support
Can go long on all dips till 980 with SL @ 900 Daily closing basis
Do your own analysis before investing

MGL- alt shark - weeklycan reach 1040-1085-1120
negation below candle closing below 960
Educational purpose only.
This is not a recommendation -
I am not SEBI registered - Do not TRADE/INVEST basis what I publish here.
Inspired by - Trading Mirror telugu

At 0.618 & Weekly 200ema Support
At 0.618 fib level support
200ema weekly support
Previous support was broken
now expect an accumulation in this level & then a gradual upmove

MGL longMGL has been forming higher highs and has been taking support on the trendline. And now again it is back to its trendline and formed a reversal bar on the weekly timeframe. The target would be 20% from the cmp.

[ INTRADAY ] MGL LONG BETrisk: Reward ratio is 1: 2
Rest as per Charts
********
Note -
One of the best forms of Price Action is to not try to predict at all. Instead of that, ACT on the price. So, this chart tells “where” to act in “what direction. Unless it triggers, like, let’s say the candle doesn’t break the level which says “Buy/Sell if it breaks”, You should not buy/sell at all.
=======
I use shorthands for my trades.
“Positional” - means You can carry these positions and I do not see sharp volatility ahead.
“Intraday” -means You must close this position at any cost by the end of the day.
=======
Always follow a stop loss.
In the case of Intraday trades, it is mostly the “Low/High of the Candle”.
In the case of Positional trades, it is mostly the previous swings
********

MglMgl correct 25 % from its top , pin bar candel form at weekly trendline , we can initiate trade if mgl trade above last week high
