MMTC 1 Hour View📈 1-Hour Timeframe Technical Overview
Trend: The stock is exhibiting a bullish trend on the 1-hour chart, characterized by higher highs and higher lows.
Resistance Levels:
Immediate Resistance: ₹70.
Key Resistance: ₹75.
Support Levels:
Immediate Support: ₹65.
Key Support: ₹62.
Pivot Points:
Central Pivot: ₹64.84
Resistance (R1): ₹66.13
Support (S1): ₹63.55
🔧 Technical Indicators
RSI (Relative Strength Index): Currently neutral, indicating no overbought or oversold conditions.
Moving Averages:
50-period EMA: Trending upwards, supporting the bullish momentum.
200-period EMA: Also trending upwards, confirming the long-term bullish trend.
MACD (Moving Average Convergence Divergence): The MACD line is above the signal line, suggesting bullish momentum.
Volume: Increasing volume on upward movements indicates strong buying interest.
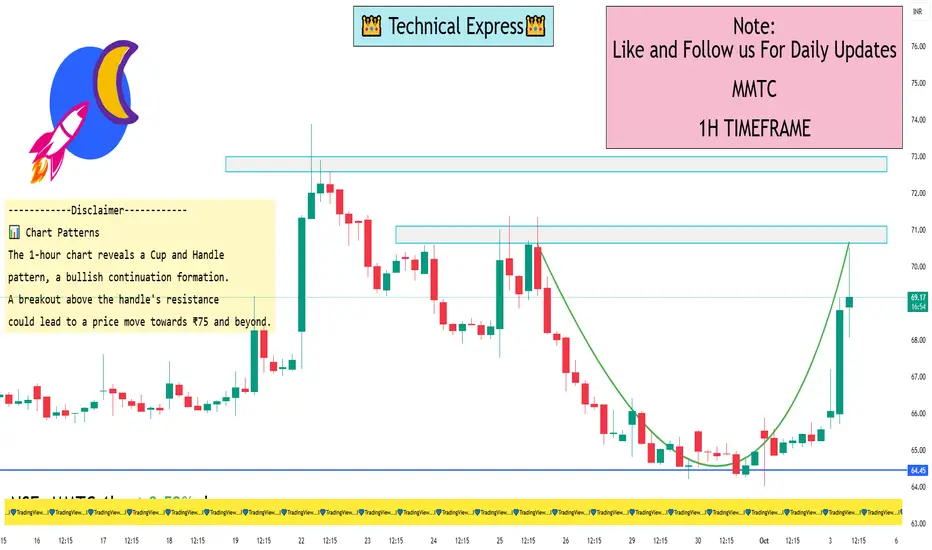
📊 Chart Patterns
The 1-hour chart reveals a Cup and Handle pattern, a bullish continuation formation. A breakout above the handle's resistance could lead to a price move towards ₹75 and beyond.
✅ Summary
MMTC Ltd is showing bullish signals on the 1-hour chart, with key resistance at ₹70 and ₹75, and support at ₹65 and ₹62. Technical indicators confirm the upward momentum. A breakout above ₹70 could signal further bullish movement.
MMTC trade ideas
#MMTC looks good for an upmoveStock has been resting ever since the massive moves made in May 2025 , the recent spike in volumes indicates a trend continuation with a text book retracement of 61.8% pullback from the most recent low . Good to keep it on radar

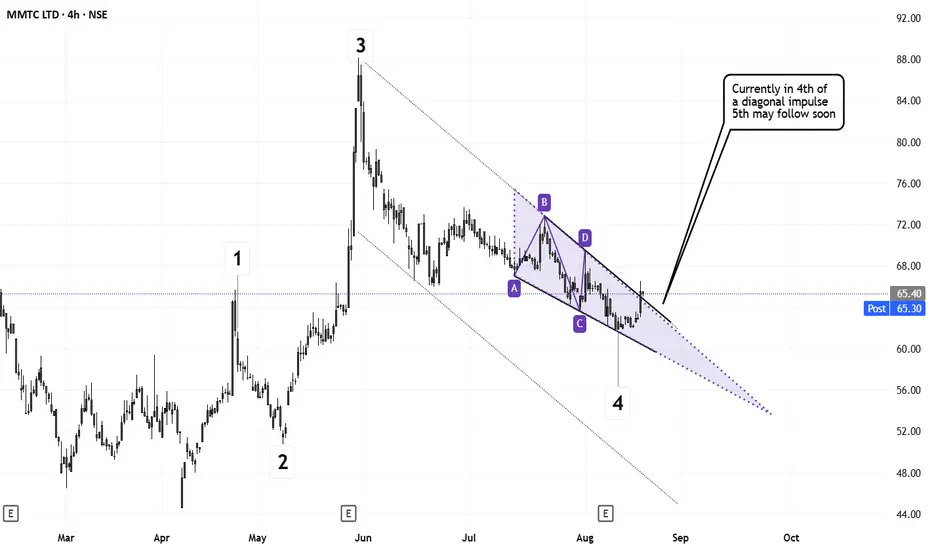
Elliott Wave Analysis of MMTCThe script is currently doing a Diagonal impulse and is in 4th of the diagonal. The 4th seems to be completing with an ending diagonal. After this, a 5-3-5 impulse should follow, making a high high on daily time-frame.
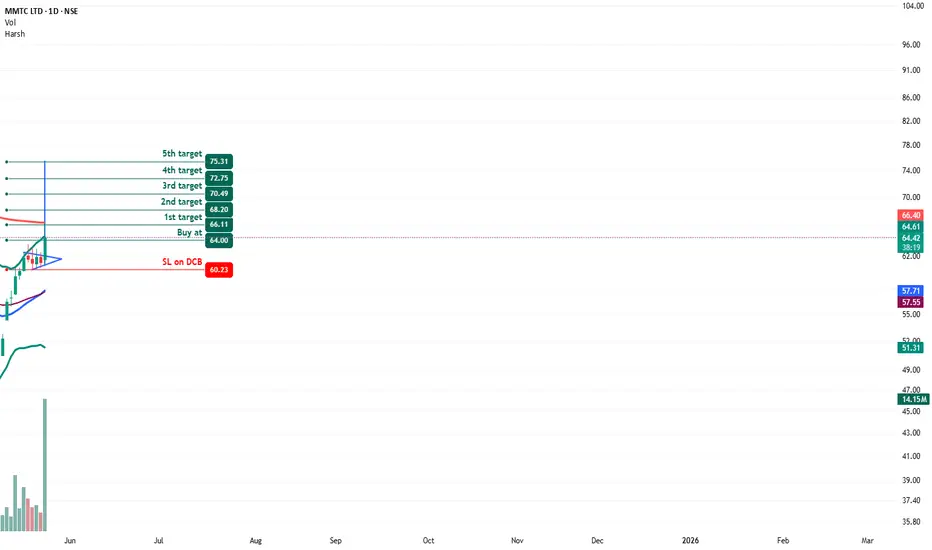
MMTC - Bullish Flag & Pole Breakout (Daily T/F)Trade Setup
📌 Stock: MMTC ( NSE:MMTC )
📌 Trend: Strong Bullish Momentum
📌 Risk-Reward Ratio: 1:3 (Favorable)
🎯 Entry Zone: ₹64 (Breakout Confirmation)
🛑 Stop Loss: ₹60.23 (Daily Closing Basis) (~6.1% Risk)
🎯 Target Levels:
₹66.11
₹68.20
₹70.49
₹72.75
₹75.31 (Final Target)
Technical Rationale
✅ Bullish Flag & Pole Breakout - Classic trend continuation pattern confirming uptrend
✅ Strong Momentum - Daily RSI > 65 & Weekly RSI >50 (Bullish zone)
✅ Volume Confirmation - Breakout volume 14.13M(while posting) vs previous day's 1.96M (Nearly 7x surge)
✅ Multi-Timeframe Alignment - Daily and weekly charts showing strength
Key Observations
• The breakout comes with significantly higher volume, validating strength
• Well-defined pattern with clear neckline breakout
• Conservative stop loss at recent swing low
Trade Management Strategy
• Consider partial profit booking at each target level
• Move stop loss to breakeven after Target 1 is achieved
• Trail stop loss to protect profits as price progresses
Disclaimer ⚠️
This analysis is strictly for educational purposes and should not be construed as financial advice. Trading in equities involves substantial risk of capital loss. Past performance is not indicative of future results. Always conduct your own research, consider your risk appetite, and consult a financial advisor before making any investment decisions. The author assumes no responsibility for any trading outcomes based on this information.
What do you think? Are you watching NSE:MMTC for this breakout opportunity? Share your views in the comments!
Everyone’s Buying MMTC… I’m Waiting for this to happen✅ CT Breakout (WTF): Well-defined CT break cleared with strong bullish momentum.
✅ Volume Confirmation: Breakout candle accompanied by 269M+ volume, signaling genuine interest.
✅ Structure: Higher low before breakout reinforces structural reliability.
✅ Base Formation: Multiple weeks of tight consolidation at base builds a solid foundation for the move.
⚠️ Caution – DTF Overextension: On the daily timeframe (DTF), price shows back-to-back green candles, indicating a short-term overbought condition.
A retracement is healthy and preferred. A direct move from here risks a poor R:R swing
📌 Conclusion:
Solid weekly breakout with all structural prerequisites in place. However, due to the extended DTF structure, wait for a healthy pullback before initiating swing entries. Avoid chasing strength. Let the price offer a clean opportunity.
🔁 Following the yellow path = strategic patience + optimal R:R.

MMTC: The Next Multibagger Stock Opportunity?MMTC Ltd, a leading public sector trading company, is gaining attention as a potential multibagger stock. With its strategic role in India’s gold, silver, and metal trading, along with promising growth prospects, MMTC shows potential for significant long-term gains. Investors are closely watching its performance, making it a stock to consider for future growth.
Buy MMTC at 40 levelsBuy MMTC at 40 levels
it can retest 140 levels again.
But keep booking profits as per comfort
3 Potential swing trading ideas for 9 jan I make educational content videos for swing / positional trading

MMTC Ltd Poised for Upside After Channel Support at 84Details:
Asset: MMTC Limited (MMTC)
Support Level: 84 (channel support)
Potential Target: To be determined based on breakout confirmation
Stop Loss: Below 84 or as per individual risk tolerance
Timeframe: Short to medium-term
Rationale: MMTC has taken support at the 84 level within its channel, signaling potential for an upward move. If buying interest picks up, the stock could see a rally, provided it sustains above this critical support.
Market Analysis:
Technical Setup: The stock has respected the channel support at 84, and its price action suggests a reversal or continuation of the upward trend.
Sector Context: MMTC, as a key player in trading and minerals, may benefit from favorable commodity trends and market conditions.
Price Target:
Potential targets will depend on confirmation of the breakout and volume support. Historical resistance levels can serve as benchmarks for initial targets.
Risk Management:
Place a stop loss below the 84 support level to minimize risk in case of further downside.
Timeframe:
Short to medium-term, depending on the strength of the bounce and overall market sentiment.
Risk-Reward Ratio:
Favorable, with a low-risk entry point near support and significant upside potential if the stock breaks out of the channel.
Watch for confirmation of upward momentum and ensure to monitor volume and market conditions closely before initiating a position.

Long term accumulation 80-90 is the range for MMTC to take support, we can add more quantity here.
Reason: 0.618 support of fibo + 200 EMA support and RSI would be around 30

MMTCMMTC is bullish stock, and now its is in correction so lets see from where it returns for the tgt of 130

MMTCMMTC Buy Zone Target and SL marked.
Only for education purpose. Investments in stock market is subjected to market risk do own researches before investing.

MMTC Weekly time frame Analysis CMP 55 buy for target 68-80-90MMTC Weekly time frame Analysis CMP 55
buy for target 68-80-90-110-125-150-190-240-290-350+
Time duration 3-4 years

MMTC Weekly Breakout with Good VolumesMMTC after consolidation of more than 10 years, Now giving breakout of its neckline near 90. Wait for a pull back or accumulate from 100-120 for the Targets of 200/300/400. Stop Loss is 65.

Very Long Term Analysis of MMTCHello Everyone,
Here is my Very long-term Analysis of MMTC. As per analysis, I am bullish for the stock as we are in the C wave. The timeframe is 6Months and soon the target is going to be hit.

MMTC- Technically visible U-turnMMTC is a company which has one of the worst fundamentals among all PSUs
News of company being scrapped were in market couple of months ago.
Only investors with high risk appetite and disposable money should be interested in this stock.
Technically, a monthly closing above 70 will be confirmation for huge breakout. Previous attempt failed but now we have only 3 sessions so worth the risk for big targets.
Good volumes are seen in past 6 months which means something big is cooking, either upside or downside. Be prepared for both if interested to invest.
If breakout is genuine, definitely huge upside potential as ATH is above 1000 which is more than 15x of CMP .

MMTC - Swing Trade Analysis - 4th July #stocksMMTC (1D TF) - Swing Trade Analysis given on 4th July, 2024
Pattern: RECTANGLE BOX BREAKOUT
- Resistance Breakout - Done ✓
- Volume Buildup at Resistance - Done ✓
- Demand Zone Retest & Consolidation (for a small SL and a better RR) - Done ✓
* Disclaimer

MMTC looks like good for multi bagger13773 Crore Market cap
PSU company
Stock PE @ 91.3
ROCE:9.18%
Company has reduced debt.
ur views plz


MMTC LOOKS STRONG RE-TESTI can clearly see the upmove in this stock re-test .
Buy and hold as per your risk
This is my view its not any type of recommendation

MMTC, DTL BO MMTC making HLs about to test DTL (Down Trend Line)
-VCP in action
-Sellers flushing out
-Check its prior moves, it moves with great momentum

MMTC CUP & HANDLE PATTERN. WAIT FOR BREAKOUT.MMTC had given a breakout on monthly basis in January 2024 and now we are seeing the pull back and retest.
Coming to a lower TF like daily or hourly we can see that it has been moving in a Parallel Channel from Aug 2023 consistantly making Higher Lows and Higher Highs.
Taking 1 HR. Time frame we can see that it is making a Cup and Handle pattern. We have yo wait for breakout on the upside, get a confirmation of making a higher low,high and can invest.
1st Target would be the latest High 101. 2nd Target would be the upper trendline of the Channel.

MMTC LTD Analyasis on 7 Jan 24MMTC LTD Analyasis on 7 Jan 24
formation of Cup & Handle pattern
Stoploss 48 (on closing basis)
40 (Deep stoploss)
target 80-90-98
