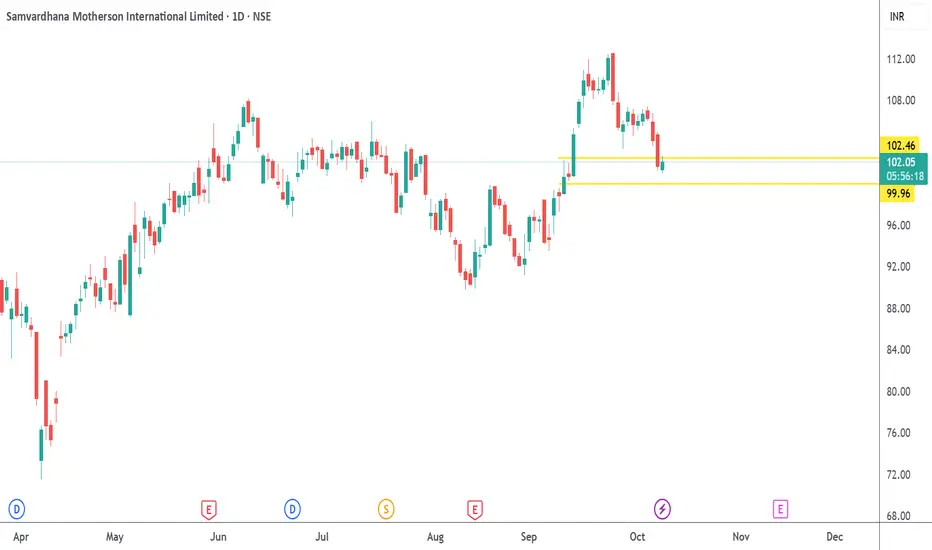
Buy MOTHERSON | Rally Base Rally on 11SEP 25Bought Date: 09 OCT 2025
Structure: Rally → Base → Rally
Setup : Demand Zone Formation on 11SEP25
Bought Price : 101.28
Exit Date: Anyday before 25 Sep 2025
Next report date
—
Report period
—
EPS estimate
—
Revenue estimate
—
3.98 INR
38.03 B INR
1.13 T INR
4.44 B
About Samvardhana Motherson International Limited
Sector
Industry
Website
Headquarters
Mumbai
Founded
1986
ISIN
INE775A01035
FIGI
BBG000CWNM56
Samvardhana Motherson International Ltd. is a holding company, which engages in the manufacture and sale of wire harnesses, components, and wires to automotive original equipment manufacturers. It operates through the following segments: Wiring Harness, Modules and Polymer Products, and Emerging Businesses. The Wiring Harness segment focuses mainly on the business of manufacturing and trading of wiring harness, its components and rendering of support service function exclusively to wiring harness operations. The Modules and Polymer Products segment includes manufacturing and supplies of plastic parts and system modules for vehicle interiors and exteriors. The Emerging Businesses segment refers to the Elastomers, Precision Metals and Modules, and Services operations of the company. The company was founded by Swarn Lata Sehgal on December 19, 1986 and is headquartered in Mumbai, India.
Related stocks
MOTHERSON 1D Time frameStock Snapshot
Closing Price: ₹105.66
Day's Range: ₹103.26 – ₹106.01
52-Week Range: ₹71.50 – ₹144.66
Market Cap: ₹1,11,518 crore
P/E Ratio (TTM): 33.54
P/B Ratio: 3.20
Dividend Yield: 0.80%
Book Value: ₹33.05
Beta: 1.64
Volume: 24,534,407 shares traded
VWAP: ₹104.93
Face Value: ₹1.00
📈
MOTHERSON - Breakout
1. Volatility Contraction Pattern (VCP) with a Breakout
Your observation of a VCP formation is spot-on. The chart clearly shows a classic cup-and-handle pattern, which is a strong bullish continuation signal. The price has been consolidating in a tight range, contracting volatility and absorbing

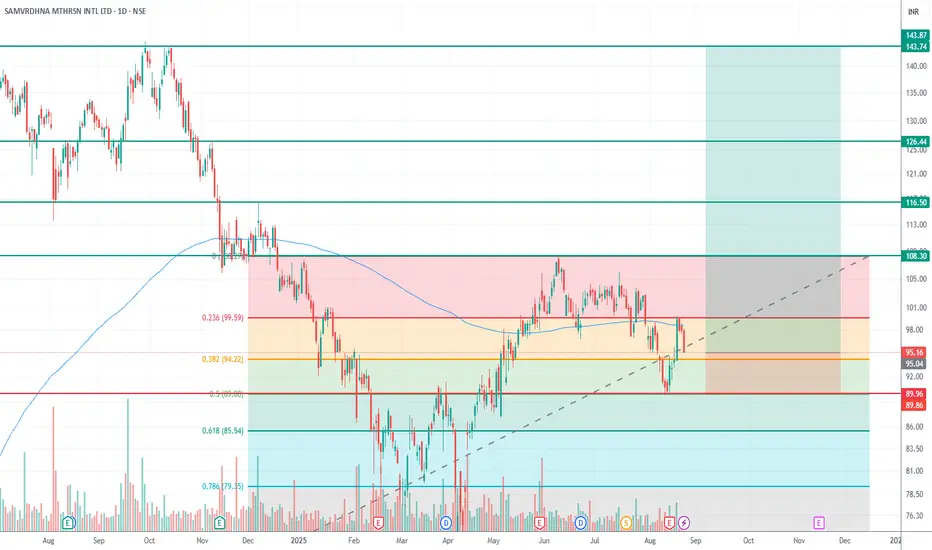
MOTHERSON (Weekly + Daily Analysis)Disclaimer: This is my personal analysis for educational purposes only. I am not SEBI-registered. Please consult your financial advisor before making any trading decisions.
🔎 Weekly Chart Setup
On the weekly timeframe, when plotting Fibonacci from the bottom (below 200 EMA) to the top (above 200 E
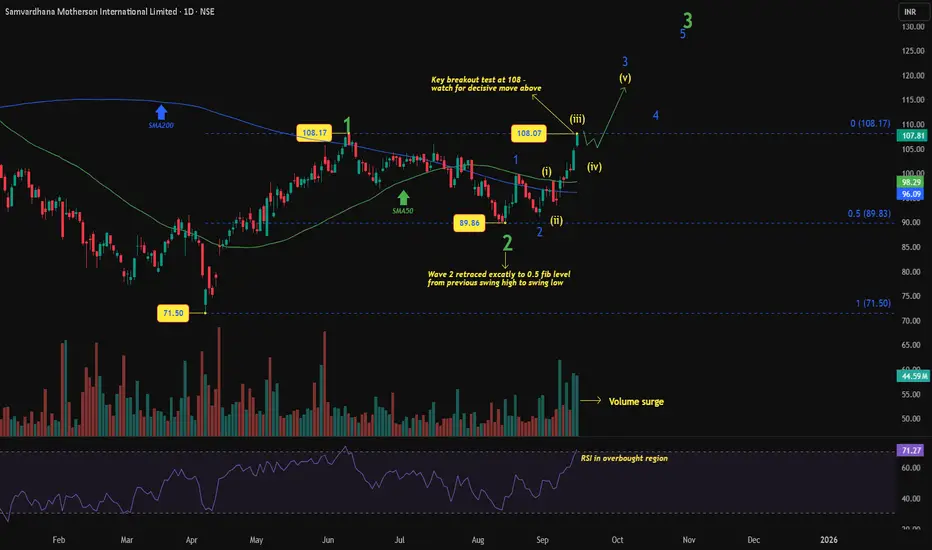
Samvardhana Motherson: Breakout or Double Top?Samvardhana Motherson has been carving a clean Elliott Wave structure since bottoming at ₹71.50.
Wave count : Wave 1 peaked at 108.17, followed by a textbook Wave 2 retracement to ₹89.86 (near the 0.5 Fib).
Current leg : Price has surged from Wave (ii) into 108, likely completing Wave (iii) of
Motherson - Cup and Handle PatternMOTHERSON exhibits a well-defined and technically strong cup-and-handle pattern, confirming a bullish trend continuation signal.
The breakout was clean and heavily volume-supported, and the retest appears to be holding—a key zone to observe for buyers.
Monitor volume and price action closely: a bo
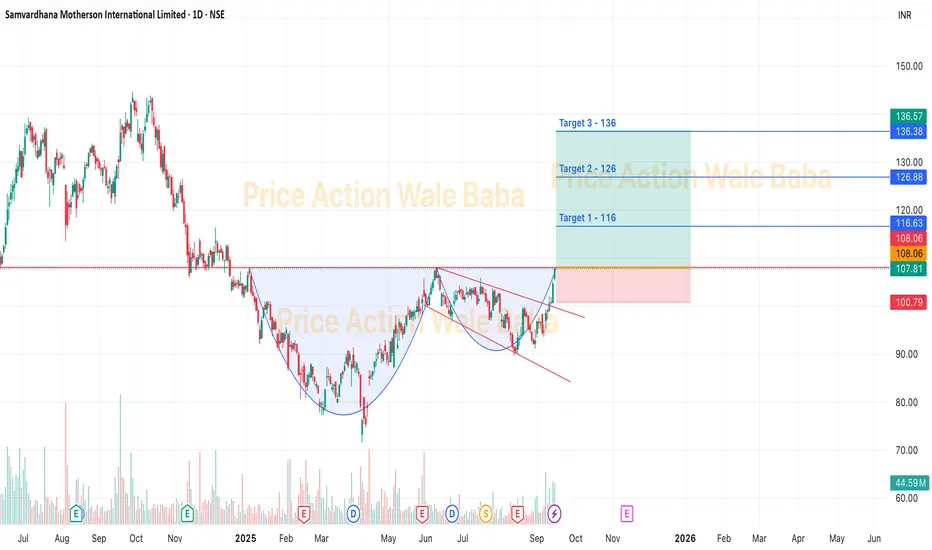
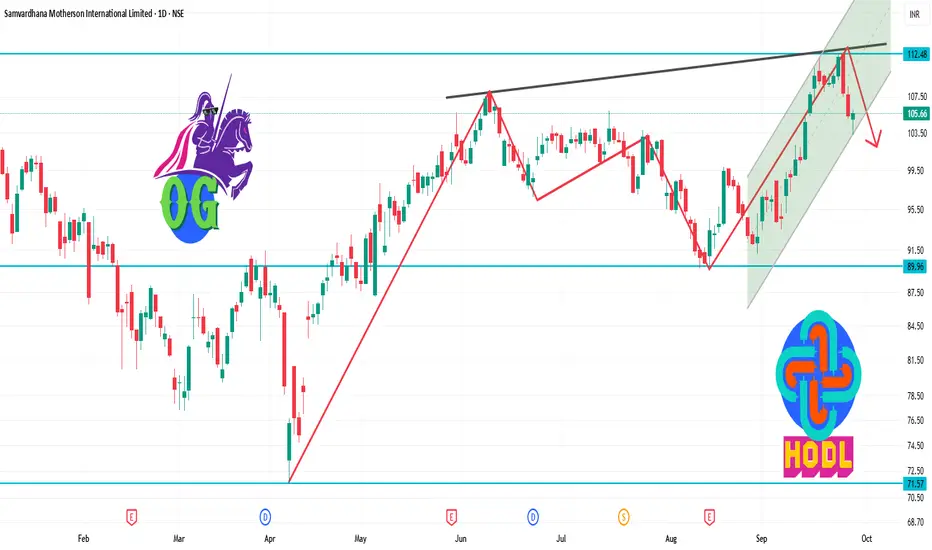
Samvardhana Motherson International (NSE: MOTHERSON) – Rising BrTechnical Setup (1D Chart)
• Stock is trending higher for the 7th straight day, up ~3% to ₹107.8, and trading volume accelerated (~44 M shares)
• Price has broken above a key horizontal resistance around ₹107–108 (purple zone) and is now supported by an upward-sloping trendline connecting recent sw

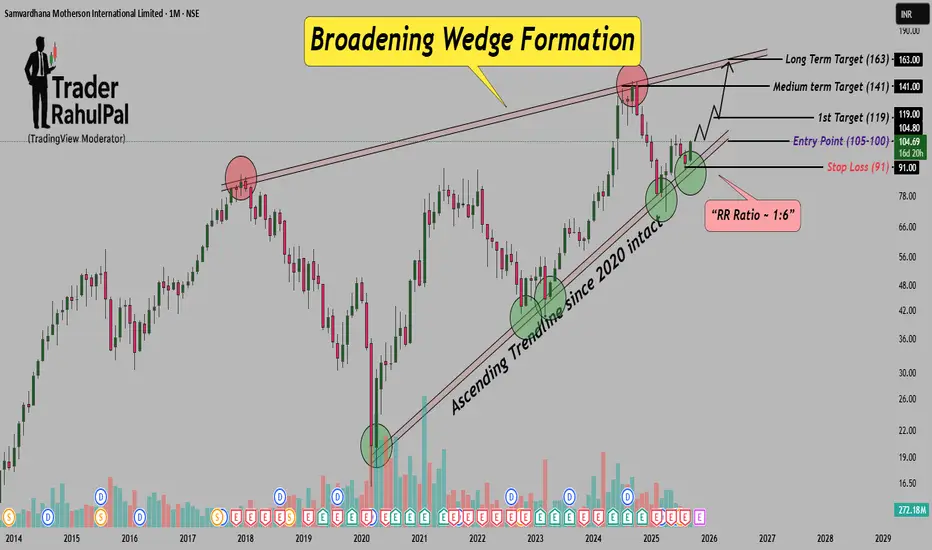
Motherson forming Broadening Wedge, Trendline support since 2020Hello Traders! Samvardhana Motherson – Broadening Wedge Breakout with Ascending Trendline Support
I hope you all are doing good in life and in your trading journey as well. Today I have brought a stock which is showing a dhamaka setup on the monthly chart – Samvardhana Motherson International
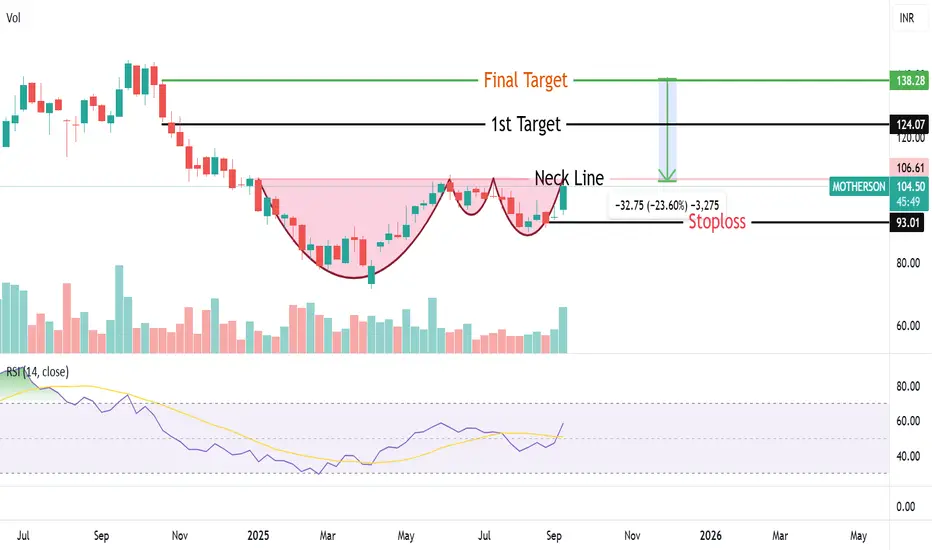
Complex CUP & HANDLE pattern in MOTHERSON MOTHERSON Formed Complex CUP & HANDLE Pattern on Daily & Weekly Chart. Breakout of it will happened above Neckline arround 107 level .Stock is trading above all important moving averages (20,50,100,200) .RSI & MACD also showing positive momentum. Target of this breakout will be arround 138 level wit
Buy, Sell, or Skip? Backtesting Charts with Bar Replay!Using TradingView’s Bar Replay, I break down an old chart and reveal the exact logic behind whether it was a buy, sell, or skip trade. Perfect for traders who want to sharpen entry-decisions with real market context.

See all ideas
Summarizing what the indicators are suggesting.
Neutral
SellBuy
Strong sellStrong buy
Strong sellSellNeutralBuyStrong buy
Neutral
SellBuy
Strong sellStrong buy
Strong sellSellNeutralBuyStrong buy
Neutral
SellBuy
Strong sellStrong buy
Strong sellSellNeutralBuyStrong buy
An aggregate view of professional's ratings.
Neutral
SellBuy
Strong sellStrong buy
Strong sellSellNeutralBuyStrong buy
Neutral
SellBuy
Strong sellStrong buy
Strong sellSellNeutralBuyStrong buy
Neutral
SellBuy
Strong sellStrong buy
Strong sellSellNeutralBuyStrong buy
Displays a symbol's price movements over previous years to identify recurring trends.
M
US784572AA7
Motherson Global Investments B.V. 5.625% 11-JUL-2029Yield to maturity
5.00%
Maturity date
Jul 11, 2029
M
SMRA5845430
Motherson Global Investments B.V. 5.625% 11-JUL-2029Yield to maturity
4.95%
Maturity date
Jul 11, 2029
815SMIL26
Samvardhana Motherson International Limited 8.15% 23-JAN-2026Yield to maturity
—
Maturity date
Jan 23, 2026
680SMIL30
Samvardhana Motherson International Limited 6.8% 27-JUN-2030Yield to maturity
—
Maturity date
Jun 27, 2030
810SMIL28
Samvardhana Motherson International Limited 8.1% 04-OCT-2028Yield to maturity
—
Maturity date
Oct 4, 2028
609SMIL26
Samvardhana Motherson International Limited 6.09% 25-NOV-2026Yield to maturity
—
Maturity date
Nov 25, 2026
See all MOTHERSON bonds
Frequently Asked Questions
The current price of MOTHERSON is 104.70 INR — it has decreased by −3.05% in the past 24 hours. Watch Samvardhana Motherson International Limited stock price performance more closely on the chart.
Depending on the exchange, the stock ticker may vary. For instance, on NSE exchange Samvardhana Motherson International Limited stocks are traded under the ticker MOTHERSON.
MOTHERSON stock has risen by 0.86% compared to the previous week, the month change is a −5.88% fall, over the last year Samvardhana Motherson International Limited has showed a −23.76% decrease.
We've gathered analysts' opinions on Samvardhana Motherson International Limited future price: according to them, MOTHERSON price has a max estimate of 140.00 INR and a min estimate of 83.00 INR. Watch MOTHERSON chart and read a more detailed Samvardhana Motherson International Limited stock forecast: see what analysts think of Samvardhana Motherson International Limited and suggest that you do with its stocks.
MOTHERSON reached its all-time high on Sep 27, 2024 with the price of 144.66 INR, and its all-time low was 0.06 INR and was reached on Jan 22, 1999. View more price dynamics on MOTHERSON chart.
See other stocks reaching their highest and lowest prices.
See other stocks reaching their highest and lowest prices.
MOTHERSON stock is 3.31% volatile and has beta coefficient of 1.82. Track Samvardhana Motherson International Limited stock price on the chart and check out the list of the most volatile stocks — is Samvardhana Motherson International Limited there?
Today Samvardhana Motherson International Limited has the market capitalization of 1.13 T, it has increased by 1.26% over the last week.
Yes, you can track Samvardhana Motherson International Limited financials in yearly and quarterly reports right on TradingView.
Samvardhana Motherson International Limited is going to release the next earnings report on Nov 13, 2025. Keep track of upcoming events with our Earnings Calendar.
MOTHERSON earnings for the last quarter are 0.48 INR per share, whereas the estimation was 0.97 INR resulting in a −50.39% surprise. The estimated earnings for the next quarter are 0.73 INR per share. See more details about Samvardhana Motherson International Limited earnings.
Samvardhana Motherson International Limited revenue for the last quarter amounts to 302.12 B INR, despite the estimated figure of 305.52 B INR. In the next quarter, revenue is expected to reach 298.61 B INR.
MOTHERSON net income for the last quarter is 5.12 B INR, while the quarter before that showed 10.51 B INR of net income which accounts for −51.28% change. Track more Samvardhana Motherson International Limited financial stats to get the full picture.
Samvardhana Motherson International Limited dividend yield was 0.65% in 2024, and payout ratio reached 15.45%. The year before the numbers were 1.03% and 19.96% correspondingly. See high-dividend stocks and find more opportunities for your portfolio.
As of Oct 17, 2025, the company has 127.89 K employees. See our rating of the largest employees — is Samvardhana Motherson International Limited on this list?
EBITDA measures a company's operating performance, its growth signifies an improvement in the efficiency of a company. Samvardhana Motherson International Limited EBITDA is 102.35 B INR, and current EBITDA margin is 9.08%. See more stats in Samvardhana Motherson International Limited financial statements.
Like other stocks, MOTHERSON shares are traded on stock exchanges, e.g. Nasdaq, Nyse, Euronext, and the easiest way to buy them is through an online stock broker. To do this, you need to open an account and follow a broker's procedures, then start trading. You can trade Samvardhana Motherson International Limited stock right from TradingView charts — choose your broker and connect to your account.
Investing in stocks requires a comprehensive research: you should carefully study all the available data, e.g. company's financials, related news, and its technical analysis. So Samvardhana Motherson International Limited technincal analysis shows the neutral today, and its 1 week rating is buy. Since market conditions are prone to changes, it's worth looking a bit further into the future — according to the 1 month rating Samvardhana Motherson International Limited stock shows the buy signal. See more of Samvardhana Motherson International Limited technicals for a more comprehensive analysis.
If you're still not sure, try looking for inspiration in our curated watchlists.
If you're still not sure, try looking for inspiration in our curated watchlists.