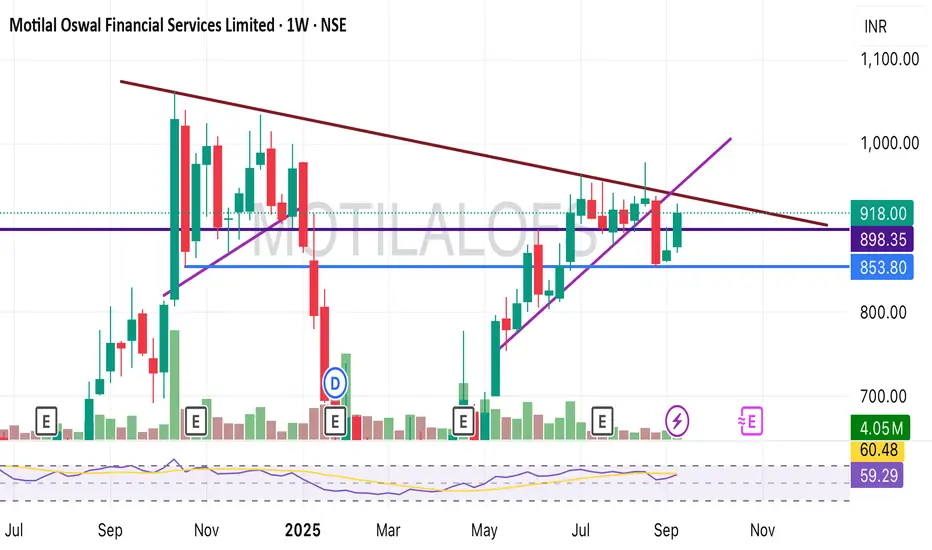
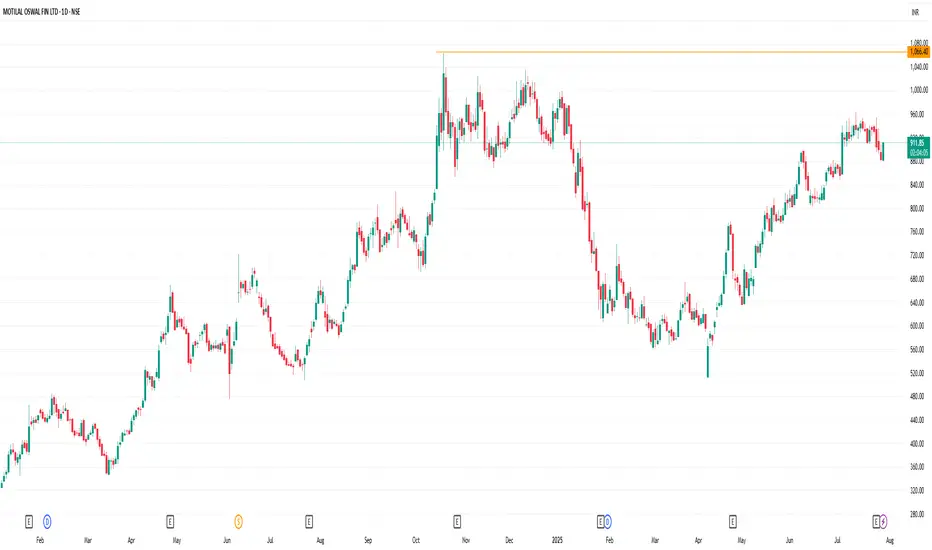
Motilal Oswal Financial Service Near the breakout Motilal Oswal Financial Service Near the breakout
Can give Trendline breakout since octo 2024
MOTILALOFS trade ideas
LONG on motilal financial servicesgoing with the financial data #motilalfinacials company is doing great there is minor drop in sales in march quarter but recovered in June quarter ..company has strong fundamental so going long on given level is good opportunity

MOTILALOFSMOTILALOFS, it is observed that inverted head and shoulder chart pattern created on this stock and this has very good potential to reward us with 30-40% in few weeks. plan your trade accordingly.
Motilal Oswal Financial Services LtdDate 13.08.2025
Motilal Oswal
Timeframe : Day Chart
MOFSL Group Services
(1) Capital markets
(2) Asset and Wealth Management
(3) Housing Finance
Revenue Split
(1) Capital Markets - 71% (54% rev earned from Brokerage)
(2) Asset & Wealth Management - 18%
(3) Housing Finance - 11%
Operational Metrics
(1) AUM Rs. 4,10,000 crs
(2) Lending Book Rs. 10,500 crs.
(3) Clients 60 crs.
Capital Markets
(1) Demat accounts increased over 3x from 47 mn to 130 mn
Asset & Wealth Management
(1) Wealth RMs increased from 123 to 221
(2) Company has a network spread 550+ cities and towns
(3) 2,500+ Business Locations operated by their Business Partners
Valuations
(1) Market Cap = ₹ 55,625 Cr.
(2) Stock P/E = 20.0
(3) Book Value = 5X
(4) ROCE = 18.7 %
(5) ROE = 25.2 %
(6) Median sales growth = 18.5% (last 10 years)
(7) Profit growth = 68.7% CAGR (last 5 years)
(8) Operating profit margin = 55%
Shareholding Pattern
(1) Promoters = 67.80%
(2) FIIs = 7.29%
(3) DIIs = 5.44%
(4) Public = 19.46%
Regards,
Ankur

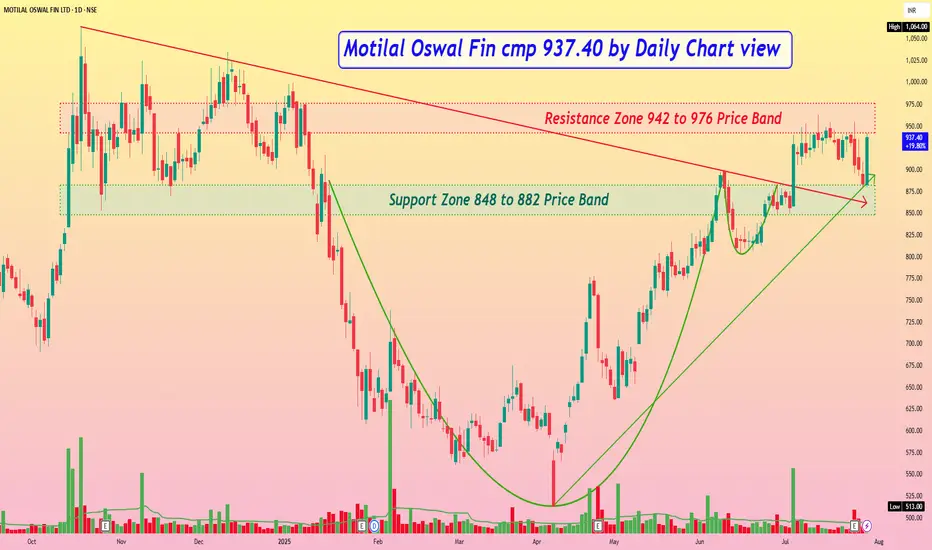
Motilal Oswal Fin cmp 937.40 by Daily Chart viewMotilal Oswal Fin cmp 937.40 by Daily Chart view
- Support Zone 848 to 882 Price Band
- Resistance Zone 942 to 976 Price Band
- Bullish Cup and Handle completed at Support Zone neckline
- Support Zone seen to be tested retested over the past 2 days
- Falling Resistance Trendline Breakout done a while back and sustained
- Selling pressure is seen around the Resistance Zone hurdle acting strongly
- Resistance Zone Breakout necessary for fresh upside as Price retraced multiple times
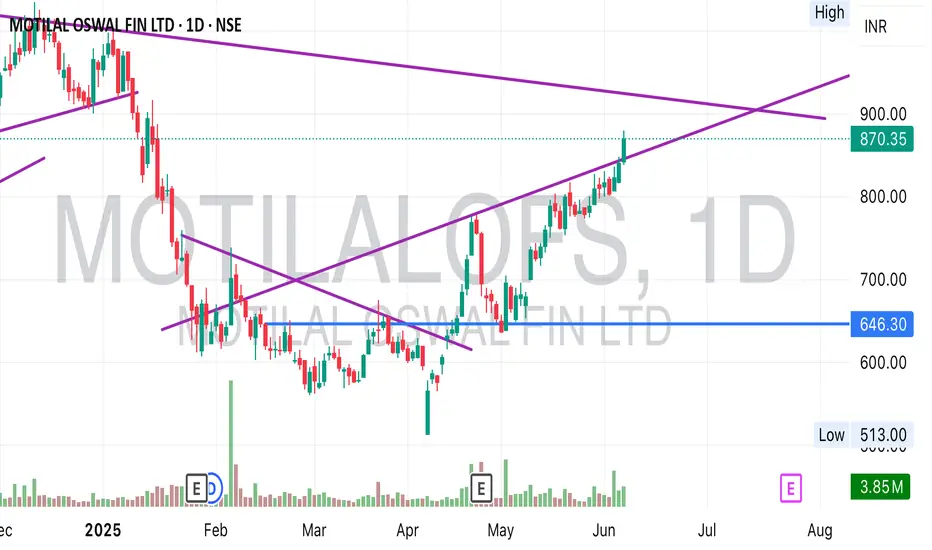
MOTILAL OSWAL: The Hidden Gem?Trendline BO + RT.
⚠️ Disclaimer: This is NOT a buy/sell recommendation. This post is meant for learning purposes only. Views are personal. Please, do your due diligence before investing.⚠️
💬 Share your thoughts in the comments below! ✌️
🔥 Trade Safe! ✅ 🚀
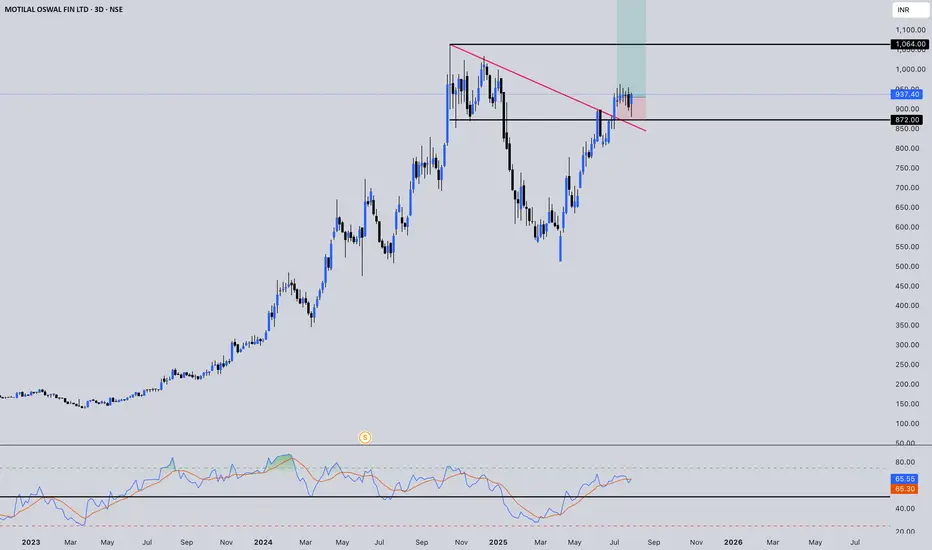
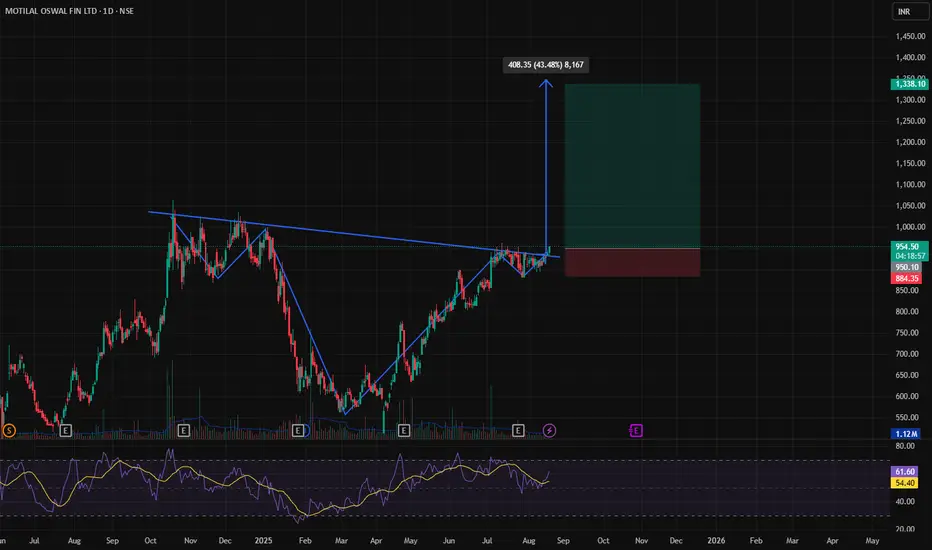
Potential Upside in Motilal Oswal Above Key ResistanceIf Motilal Oswal breaks above the ₹1064 high, it could signal the start of a strong upward move. In that case, there is potential for the stock to rally towards ₹1500, provided the breakout is backed by strong volume and market sentiment. This level can act as a key trigger for bullish momentum.
BUY TODAY SELL TOMORROW for 5%DON’T HAVE TIME TO MANAGE YOUR TRADES?
- Take BTST trades at 3:25 pm every day
- Try to exit by taking 4-7% profit of each trade
- SL can also be maintained as closing below the low of the breakout candle
Now, why do I prefer BTST over swing trades? The primary reason is that I have observed that 90% of the stocks give most of the movement in just 1-2 days and the rest of the time they either consolidate or fall
Cup and Handle Breakout in MOTILALOFS
BUY TODAY SELL TOMORROW for 5%

MOTILALOFS Price actionMotilal Oswal Financial Services Ltd (MOTILALOFS) has experienced **strong price momentum over the past year, rising more than 50%**. The stock recently traded between ₹854 and ₹929, with its all-time high of ₹1,064 reached in October 2024 and a 52-week low near ₹488.
**Short-term action:**
In the last week, the stock moved up by about 0.4%, and in the past month, it gained nearly 7%. Over three months, the gain was especially notable at nearly 40%. However, the stock is highly volatile—about 3.8 times as volatile as the Nifty index—and has a high beta of 1.79, indicating large price swings.
**Recent trend:**
After peaking above ₹1,000 in late 2024, MOTILALOFS saw a correction, dropping to the ₹700-800 range by mid-2025. Since then, it has rebounded, climbing back above ₹850. The last few sessions show a mix of minor gains and losses, reflecting ongoing volatility and active trading interest.
**Volume and liquidity:**
Trading volumes have been robust, with some sessions seeing over a million shares traded, especially during sharp moves. This indicates strong liquidity and sustained investor interest.
**Valuation and fundamentals:**
The stock is considered overvalued relative to market averages, with a price-to-earnings ratio above 20 and a price-to-book ratio above 4. Its dividend yield is modest at 0.58%. Despite high volatility, the company has delivered solid profitability and efficiency metrics, with return on equity above 25%.
**Outlook:**
Analysts remain optimistic, with some forecasting potential upside toward ₹1,150, though downside risk remains to ₹763. The company’s business is diversified across broking, asset management, investment banking, and housing finance, and recent results show strong revenue growth, especially in wealth management and housing finance. However, there have been short-term challenges, such as a decline in cash market share and weaker performance in private wealth management.
**Summary:**
MOTILALOFS is in a recovery phase after a sharp correction, showing renewed upward momentum but with high volatility. The outlook is positive, supported by strong fundamentals and sector growth, but investors should remain cautious due to the stock’s elevated valuation and price swings.
Motilal Oswal Financial Breakout on Daily & weekly chart Motilal Oswal Financial Services Ltd. was founded in 1987 is a well-diversified financial services firm. The company has a network spread 550+ cities and towns comprising 2,500+ Business Locations operated by their Business Partners and 16,00,000+ customers.
MOTILALOFS |Cup and Handle pattern | Daily Here is a detailed **technical analysis** of the **Motilal Oswal Financial Services Ltd (MOFSL)** daily chart
---
## 🔍 **Motilal Oswal – Daily Chart Technical Analysis**
### 🧩 **Chart Patterns Observed**
#### 1. **Falling Wedge Pattern (Bullish Reversal)**
* After a significant downtrend of \~25% (from ₹909 to ₹685), the stock formed a **falling wedge**, a classic bullish reversal pattern.
* The breakout from this wedge marked the end of the downtrend and the start of base-building.
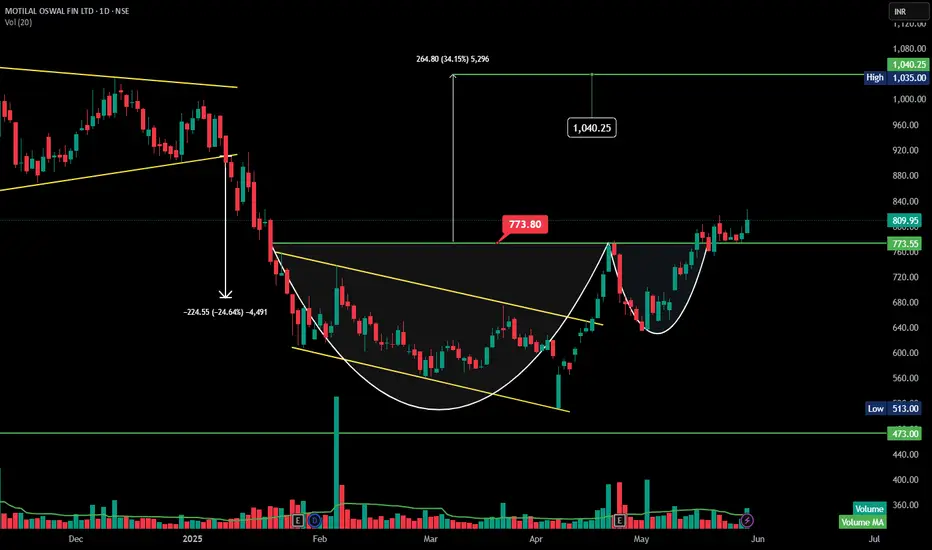
#### 2. **Cup and Handle Breakout**
* The stock formed a **smooth, rounded bottom** (the cup) between February and April.
* A shallow **handle formation** followed, confirming healthy consolidation before the breakout.
* **Breakout above ₹773.80**, which was the neckline of the cup pattern, has triggered bullish momentum.
---
### 📏 **Price Action & Measured Move**
| Component | Value |
| -------------------- | ------------------------------------------ |
| Cup Low | ₹513 |
| Neckline (Breakout) | ₹773.80 |
| Depth of Cup | ₹773.80 - ₹513 = ₹260 |
| Measured Move Target | ₹773.80 + ₹260 = **₹1040** *(minimum)* |
But the chart suggests a **larger swing target**:
* **Upside projection:** ₹773.80 + ₹264.80 = **₹1,040.25**
* This is based on broader trendline breakout from wedge to neckline move.
---
### 📊 **Volume Analysis**
Volume is missing during breakout
---
### 🔑 **Key Technical Levels**
| Level Type | Price (₹) |
| --------------------------- | --------- |
| Breakout Zone | 773.80 |
| Immediate Support | 773.55 |
| Strong Support (Trend Base) | 640 |
---
### 📌 **Technical Conclusion**
✅ **Bias:** Strongly **Bullish**
* The breakout above ₹773.80 confirms bullish momentum.
* With current price at ₹809.95, it has already moved \~36 points from the breakout — early entry window may be closing.
⚠️ **Next Steps:**
* Traders may **trail SL** to breakout zone (₹773–774).
* Watch for follow-through above ₹820 for confirmation toward **₹1,040 target**.
* Any retest of ₹780–790 zone may offer a **high-probability entry**.
---
### 🎯 **Trade Strategy**
| Strategy Type | Action |
| ------------- | ------------------------------------------ |
| Swing Trade | Buy on dips near ₹790–₹800; Target: ₹1,040 |
| Stop-loss | ₹772 (below breakout + handle support) |
| Risk-Reward | \~1:3 if targeting ₹1,040 |
---
MOTILALOFS🚀 MOTILAL OSWAL FIN LTD
What we're seeing:
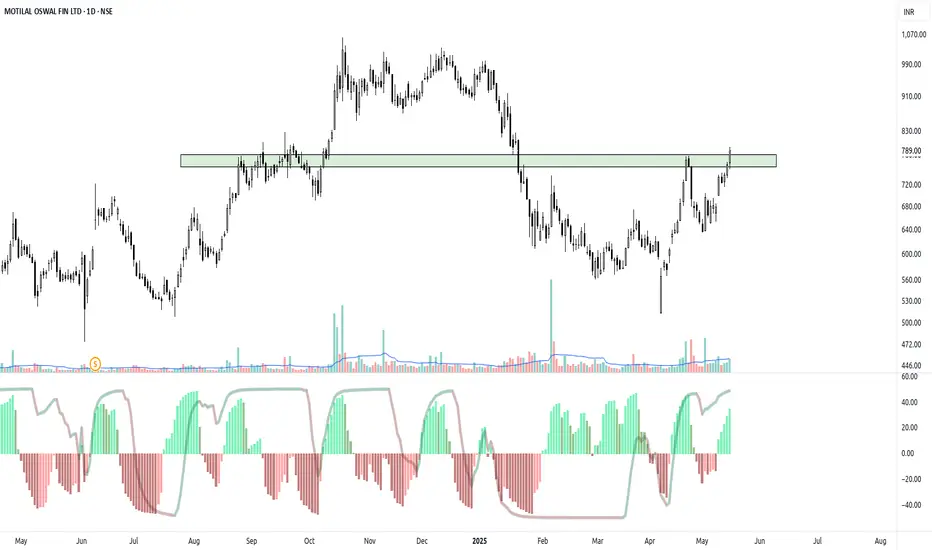
The stock has shown impressive strength, making a decisive breakout above a significant resistance zone (highlighted in green around ₹740-₹770)! 🟢 This move is backed by healthy volume, adding conviction to the upside. It's a classic resistance-turned-support scenario in the making.
Potential Setup:
This breakout suggests a continuation of the bullish trend. We could look for:
Entry: A potential long entry either at current levels if the momentum sustains, or ideally, on a retest of the breakout zone (₹740-₹770), which could now act as strong support. 🎯 This would offer a better risk-reward entry.
Targets: Initial targets could be the previous highs around ₹950-₹1000, with potential for further upside if the broader market and stock momentum continue. 💰
Stop Loss: Place your stop loss comfortably below the newly established support zone, perhaps around ₹700 or a recent swing low, to manage your risk effectively. 🛡️
Important Note: Always remember to manage your risk carefully, use appropriate position sizing, and consider your own trading plan. Trade smart! 🧠📊
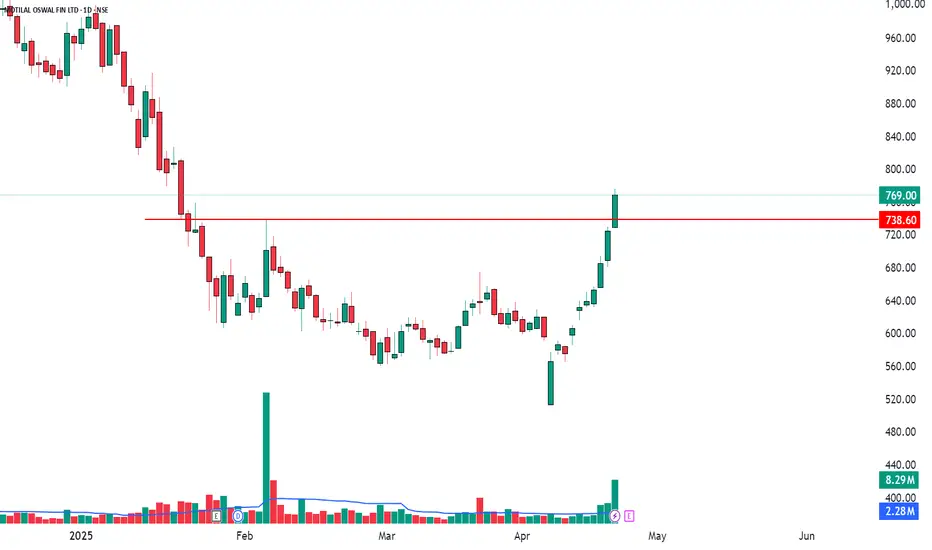
Bullish Momentum with RSI and Bollinger BreakoutMOTILALOFS (6.16%)
Bullish Trend and Breakout
MOTILALOFS is showing strong bullish momentum, with a Bullish Marubozu candlestick signaling the continuation of upward momentum. The RSI Breakout and Bollinger Band Breakout both point to an increase in buying pressure. The volume has seen a notable uptick, confirming the strength of the bullish move.
Resistance Levels: 787-805-834
Support Levels: 740-711-693
Entry: @/above 775.95
Stop Loss: @/below 653.65
Volume Analysis: Volume has been significantly higher than average, with a noticeable volume of 8.29M on 23rd April. This suggests that institutional or large players might be entering the stock.
MotilalofsLet's dive into the **technical analysis** for **Motilal Oswal Financial Services Ltd. (MotilalOswal)** based on typical indicators and technical tools. Again, since I don’t have real-time market data, the analysis provided below is a general framework based on how you can approach the analysis.
---
### **Technical Analysis of Motilal Oswal Financial Services Ltd. (MotilalOswal)**
#### **1. Support and Resistance Levels**
- **Support Levels:**
- These are areas where the stock has historically found buying interest and reversed direction. Look for recent lows.
- **Example Support Levels:** If Motilal Oswal recently bounced around ₹1,000 or ₹950, these could be seen as key support levels.
- A breakdown below these support levels could signal further weakness and a potential downtrend.
- **Resistance Levels:**
- Resistance levels are price zones where selling pressure has historically emerged. If the stock has had difficulty breaking through ₹1,150 or ₹1,200 recently, those could act as resistance zones.
- If the stock manages to break above these levels with strong volume, it may signal a potential upward breakout.
#### **2. Moving Averages (MA)**
- **50-day MA:** The 50-day moving average helps assess the short-term trend. If the stock is trading above this level, it indicates short-term bullishness. If below, it may indicate short-term bearish momentum.
- **Example:** If the stock is at ₹1,100 and the 50-day MA is ₹1,090, it suggests short-term bullish momentum.
- **200-day MA:** The 200-day moving average is considered a long-term trend indicator. If the stock is trading above it, it indicates a bullish long-term trend; if below, it signals a bearish trend.
- **Example:** If the stock is at ₹1,100 and the 200-day MA is ₹1,080, it indicates a bullish long-term trend.
#### **3. RSI (Relative Strength Index)**
- **RSI Levels:**
- **Above 70:** The stock is potentially overbought, indicating that it may face a pullback or consolidation.
- **Below 30:** The stock is potentially oversold, suggesting it may be due for a reversal or upward movement.
- **Current Example:**
- If the RSI is at **75**, the stock might be in overbought territory, signaling a potential pullback.
- If the RSI is at **25**, the stock could be oversold, indicating a possible bounce or reversal to the upside.
#### **4. MACD (Moving Average Convergence Divergence)**
- **Bullish Cross:** When the MACD line crosses above the signal line, it typically indicates an upward trend or buying signal.
- **Bearish Cross:** When the MACD line crosses below the signal line, it signals a potential downtrend or selling signal.
- **Current Example:**
- If the MACD line is above the signal line, it suggests a bullish trend for Motilal Oswal.
- If the MACD line crosses below the signal line, it may signal a bearish move.
#### **5. Volume Analysis**
- **Increasing Volume:** When the stock rises with increasing volume, it suggests strong buying interest, confirming the price movement.
- **Decreasing Volume:** If the stock rises or falls with decreasing volume, it may signal a weakening trend.
- **Current Example:**
- If the stock is pushing higher with increasing volume, it indicates strength in the upward move.
- If the stock is declining with rising volume, it could indicate that the downtrend is strong.
#### **6. Candlestick Patterns**
- **Bullish Patterns:** Patterns like **Hammer**, **Bullish Engulfing**, and **Morning Star** during a downtrend suggest potential reversals to the upside.
- **Bearish Patterns:** Patterns like **Shooting Star**, **Evening Star**, and **Bearish Engulfing** during an uptrend signal potential reversals to the downside.
- **Current Example:**
- If a **Bullish Engulfing** pattern is formed near support, it could suggest a reversal to the upside.
- If a **Shooting Star** or **Evening Star** pattern is formed near resistance, it could signal a reversal to the downside.
#### **7. Fibonacci Retracement Levels**
- Fibonacci levels are used to identify potential support or resistance areas during a pullback or retracement. The key levels are 23.6%, 38.2%, 50%, and 61.8%.
- **Current Example:**
- If the stock has moved from ₹950 to ₹1,150, check for pullbacks to the **38.2%** retracement level around ₹1,080 or **50%** retracement around ₹1,050. These could act as support zones for the stock to bounce back.
---
**Disclaimer:**
- I am not a SEBI-registered professional or licensed financial advisor.
- All analysis, recommendations, and opinions provided are based solely on historical price data, patterns, and general market trends.
- Any action you take on the basis of this information is at your own risk. Please consult with a licensed financial advisor before making any investment decisions.
- Technical analysis cannot guarantee future results and may not be accurate in predicting market movements.
- Market conditions and stock prices can be influenced by many factors, including external events, news, and economic data, which are beyond the scope of this analysis.

Motilal oswal stock at critical support.Can Motilal oswal hold this critical support for upcoming pump but if it's loose this support we will say a blood bath.

A little risk big award motilal around 720 levelsMotilal can be bought around 718-720 levels with sk around 695 for the target of 750+++ 790+++ 850++ just a result play maintain proper sl as per your risk

A condition buy on Motilal just a result play For the result, a conditional buy can be initiated in Motilal Oswal financial services around 1030 with strict sl around 984 for the target of 1080+++ 1125+++ 1187+++ 1287+++. Trading is a risky profession maintain SL and buy quantity as per your risk appetite

Motila in buy zone around 912-914 levels ?Motilal is trading in the demand zone around mal 910-914 levels so it can be added with a small stop loss around 895 levels for a target of 945+++ 975+++ 1015+++ 1057++ and soon just a result trade. Maintain proper sl and take quantity as per your risk and reward.

Motilal Breakout in Progress!📈 Potential Upside:
The stock could make a strong move if it breaks above the 1️⃣0️⃣2️⃣0 level.
👀 Keep an Eye Out:
Stay tuned to the chart for potential trading opportunities.
🎯 Trade Levels:
Refer to the chart for specific entry, target, and stop-loss levels.

Motilal Oswal - Ready to FireThis stock has following attributes
1) Price > 50 DMA
2) 50 DMA > 200 DMA and diverging
3) Daily vol > Avg 30 D Vol
4) Supertrend 14,3 Buy zone
5) ADX > 25 and rising - Momentum increasing
6) Tested the 52 week high thrice.
7) Has held up reasonably during the past correction.
This stock will break out and then follow the parallel channel once it gets in to it.
This analysis is academic purpose and not a recommendation to BUY.

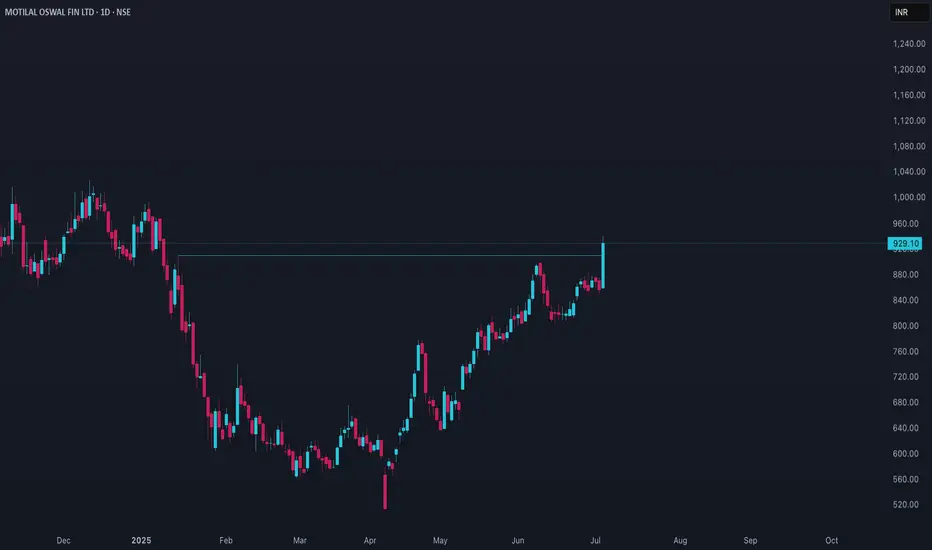
Motilalofs !! ready to continue up side as seller exhaustedMotilalofs !! ready to continue up side
Showing continuous strength on the chart with sellers exhausted in last month. current candle broke high of red candle which shows bullishness in stock

MOFS🚀 Breakout Alert: Motilal Oswal Financial Services Ltd (MOFS) 🚀
📈 Breakout from a wedge pattern on the daily chart!
✅ Currently trading at ₹1,010.55.
📊 Potential target: ₹1,213 (+19.4%).
🕒 Volume showing consistent support, and RSI trending positively! Momentum is strong, with ₹1,064 as the immediate resistance to watch. Enter after confirmation..
Disclaimer: I am not a SEBI-registered analyst. Views are personal and for educational purposes only. Please consult your financial advisor for any investment decisions.
#StockMarket #BreakoutStock #MOFS #Trading

Breakout Soon in MOTILAL OSWALAscending Triangle Breakout Setup
RSI near 65 and rising
Trading above EMA50
Volume increasing
Testing ATH
Enter after confirmation
Disc: for study, not a recommendation
