Trade ideas
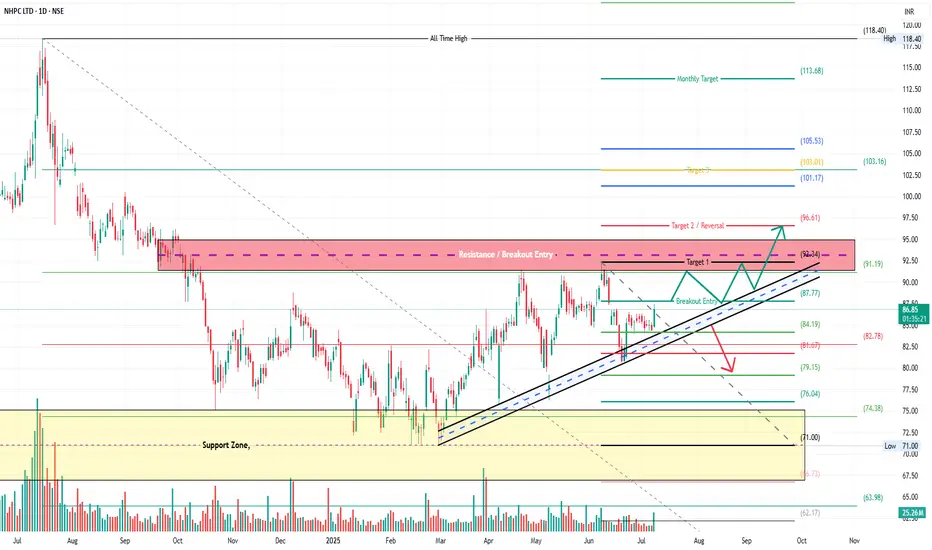
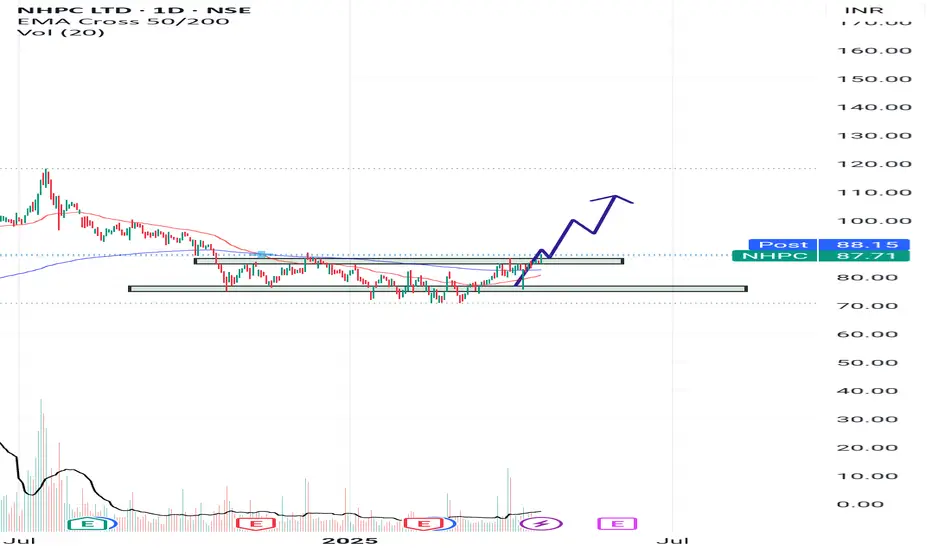
NHPC Trendline Breakout Setup | Eyeing ₹113+ Target ZoneNHPC has formed a bullish structure on the daily chart with multiple higher lows and now attempts a trendline breakout above the key zone of ₹87–₹91. This level overlaps with previous resistance and Fibonacci confluence, making it a critical breakout setup.
A successful breakout above ₹91.19 can propel prices toward ₹96+ and possibly ₹113 in the coming weeks.
Key Technical Observations:
Pattern: Ascending Trendline + Resistance Breakout
Breakout Entry: ₹87.77 to ₹91.19
Volume: Rising steadily, indicating accumulation
Resistance Zone: ₹92.34 (Target 1), ₹96.61 (Reversal Zone)
Target Levels (Fibonacci Extensions):
Target 1: ₹92.34
Target 2 / Reversal: ₹96.61
Target 3: ₹103.01
Extended Targets: ₹105.53 – ₹113.68
All-Time High: ₹118.40 (next major resistance)
Invalidation & Risk:
Breakdown below ₹84–₹82.78 zone invalidates the bullish setup
Price may revisit support near ₹76 or the broader support zone at ₹71 if breakout fails
Conclusion:
If NHPC sustains above ₹91 with volume, the breakout setup remains valid with good upside potential. Keep trailing stop loss as it approaches resistance zones.
Disclaimer:
This analysis is for educational purposes only. Not a recommendation. Always do your own research or consult a SEBI-registered financial advisor before investing.
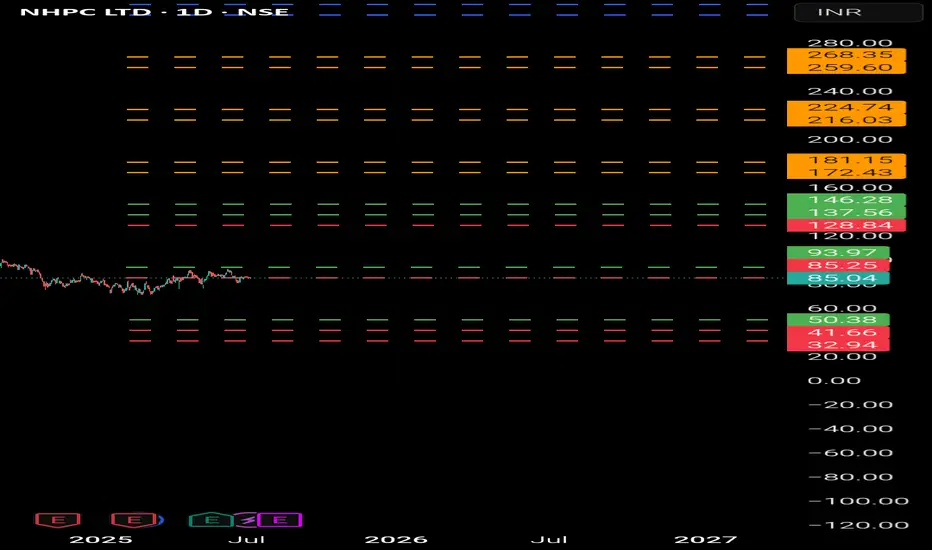
NHPC (NHPC Ltd)- AnalysisBullish Scenario
Early bullish indication above 94 (higher risk).
Safer entry points: sustained trading above 128-146 for a week.
Potential targets: 172-181.
Further upside expected if 172-181 holds for 1-2 weeks, targeting 216-224, then 259-268, and potentially
303-312 or 346-355
Bearish Scenario :
Exit swing trades if the price consistently stays below 85 for 3-5 days.
Key support levels: 50 or 41. Long-term investors should consider a stop-loss at 32, as prices below this indicate a significantly more bearish
outlook.
**Consider some Points buffer in above levels
**Disclaimer -
I am not a SEBI registered analyst or advisor. I does not represent or endorse the accuracy or reliability of any information, conversation, or content. Stock trading is inherently risky and the users agree to assume complete and full responsibility for the outcomes of all trading decisions that they make, including but not limited to loss of capital. None of these communications should be construed as an offer to buy or sell securities, nor advice to do so. The users understands and acknowledges that there is a very high risk involved in trading securities. By using this information, the user agrees that use of this information is entirely at their own risk.
Thank you.
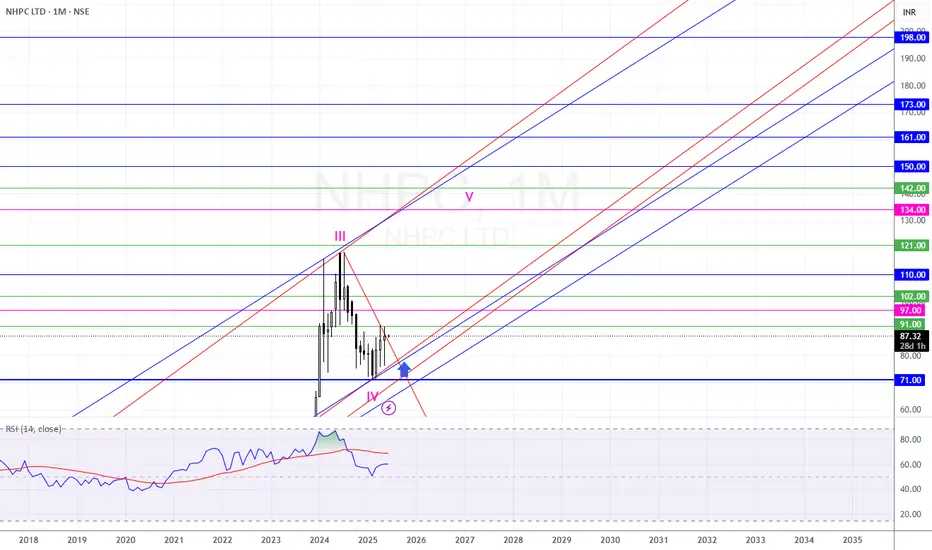
NHPC LTD @ 87.xx - Analysis on 02-Jun-2025LTP 87.xx
Support 71/14
Are we in the final bull run for this UP MOVE?
As long as 71 holds support and a break of 91, I expect to see 121 first.
Other targets are in the chart.
ULTIMATE TARGETS: 97/121/134/150/173/198
NHPC - Trade Options NHPC. CMP: 86.02; RSI: 65.32
Rounding Bottom formation was seen and RSI is also giving positive divergence. If stock holds 81.5 levels, up move is likely in the script. Trade for swing trade.
Entry: On confirm breakout- above 92 Levels (1 H resistance zone)
Target: 98-104
Stop Loss: 81.5
✅ For More Such Trading Idea stream Like this, Share and Follow, MY IDEA STREAM ✅

NHPCThe stock have formed a rounding bottom on Daily candle and took out the major supply zone, ready for upmove
NHPCNHPC, a Mini Ratna category I public sector utility, is Government of India’s flagship hydroelectric generation company. The company is primarily involved in the generation and sale of bulk power to various Power Utilities. Its other business includes providing project management / construction contracts/ consultancy assignment services and trading of power.
HOW IDENTIFY INVESTMENT CONCEPT : WHEN INSTITUTION TAKE PROFIT AVERAGE 50% IN DOWN MARKET. THIS CASE 76INR.

Positional or Longterm Opportunity on NHPCGo Long @ 84.65 for Targets of 91.6, 98.55, 105.5 and 112.45 with SL 77.7
Reasons to go Long :
1. On a Monthly timeframe if we draw the Fibonacci retracement tool from the recent swing low (point A) to the recent swing high (point B) then we see stock took support from the 0.382 Fibonacci level.
2. In addition to this a bullish candlestick pattern Bullish Harami (marked with orange color) is formed around the 0.382 Fibonacci level.
3. Also there is a strong support zone (marked with green color), from which the stock is taking support and moving up.

Go long in NHPC above 85.50 closing If NHPC closes above 85.50 on daily frame then we can expect targets of 88,92,97 & 102.
Trade active only it closes above 85.50.
Stoploss for this investment can be placed near 80.

Go long in NHPC above 85.50 closing If NHPC closes above 85.50 on daily frame then we can expect targets of 88,92,97 & 102.
Trade active only it closes above 85.50.
Stoploss for this investment can be placed near 80.

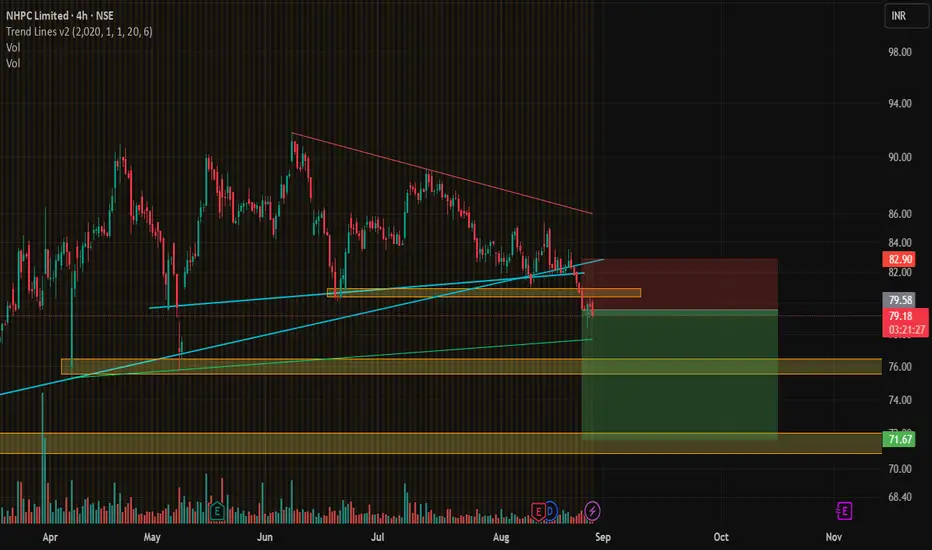
NHPC "A POSSIBLE SWING TRADE"The stock appears to be recovering from a prior downtrend.
The formation of higher lows suggests the emergence of a potential uptrend.
we can see volume spikes with positive price action
breakout trade /swing trade is possible once price close above 85

NHPCAfter a fall of 34% from the High of 118.40, it took support at 77.50 for the 4th time forming a W pattern. we can see a slight volume pump. In last 3 trading session its consolidating in a range of 80.80 to 83.40, closing above 83.40 can get quick move till 85.00 where it can face resistance.
Daily closing above 85.00 will activate W pattern and we can target for 91.50 and 95 level with SL of 83.40

NHPC 1D T FNSE:NHPC is near a demand zone which has multiple touch points making it stronger. This can be traded either up or down. We can wait for confirmations from the price and then we can get into the trade
Disclaimer:- This analysis is only for educational purpose. Please always do your own analysis or consult with your financial advisor before taking any kind of trades

NHPC NSE:NHPC
as per my analysis on chart we have three support where we can add more quantity to average buying price
S1 - 91
S2 - 86
S3 - 77
any closing below this level will make you exit/average out as NHPC is good for the long term

NHPC Long term betNHPC is a good long term bet. A government company with good focus on renewable source.
Target and STOPLOSS marked.

IS IT TIME FOR REVERSAL IN NHPCNHPC has been moving in a Parallel Channel from January. No green candle has closed above the upper trendline. There is also a Resistance Zone between 115-119.
After testing the above resistance zone the price has been continuously falling to touch the Bottom Trendline. Yesterday a green candle has been formed signalling a trend reversal.
A buy can be initiated above the candles high for a 1st Target of 116 and a 2nd target of 126 if it breaks the Resistance zone.

Nhpc Long Buy below/at 95
Target 3 = 107.30 with trailing stop loss
Target 2 = 103.32 with trailing stop loss
Target 1 = 99.19
Stop loss = 90.93
Just paper trade,
This is not a financial advice.

UPCOMING SET UP SERIES SCRIPT - 5
SHARED ANALYSIS based on purely price action only for a technical aspect. Described level does not need to necessarily be observed….
KEEP ADDING to your watchlist and wait patiently for described level ( It may / may not be takes time )
LONG TERM INVESTORS can use described levels to accumulate OR hold….

NHPC chart analysisHello All,
As per chart analysis of NHPC, break out has been achieved above strong resistance at 103-105 level.
Expected continue uptrend with short term target of 130 levels.
Kindly know this is not a financial advice. Please do Your own research before investing.
Thank You.

NHPC Ltd. @ 104.62Sector: Power Generation/Distribution
52 Week High 118.40
52 Week Low 44.85
All Time High 118.40
All Time Low 14.80
Book Value Per Share 37.61
Sector PE 24.33
Face Value 10
Beta 0.95
Mkt Cap (Rs. Cr.) 105,091
Supports: 73/37/14
Upside can be 121, 134, 155-160
NOTE: Not a BUY or SELL SIGNAL.
All updates are only for the educational and knowledge purpose.

NHPC LTDImportant points ploted in the chat.
*Investing in security market is subjected to market risk do own research before investing.

NHPC bullish; above 118 ? - Monday 15-July.The above information does not constitute investment/trading recommendation and it is purely for educational purpose....
INTRADAY Trading Strategy in 3 stages of breakouts:
1) Impulse upmove stage: The strong upmove (nearly upto 1.5% from trigger-price) happens within five minutes. "High Risk Traders" buy on breakouts in hope of continuation of upmove. "High Risk Traders" may have to patiently wait through the Pullback-Consolidation stage to realize profits. High risk:High reward set up as breakouts may fakeout (reversal)also
2) Pullback-Consolidation stage: After the above "Impulse upmove stage"; the price may then pull back and move sideways (between "Open" price and "High" of the above "Impulse upmove stage"). "Safe traders" with minimum risk profile wait for a breakout from the consolidation stage to enter into trade , to book high profits in the final "Breakout continuation" stage
3) Breakout continuation: Stocks often in the third stage breaks up above the "High" of the first "Impulse upmove stage" and continue to go higher again.(another 2-3%)
Both Safe Traders/High Risk Traders book profits at this stage
SWING Trading Strategy:
Position is kept open, only upon stock closing above the entry price on day closing basis and is held on for 5-10 trading sessions for larger gains (5-10%)
The above information do not constitute, financial, investment, trading, or other types of advice or recommendation.It is purely for educational purpose....

NHPC--Symmetrical triangle pattern Breakout
--Consolidating tight range
--Double bottom
--shortterm Target green horizontal lines
-mid term Target 140/150
--Long term target 200/220
Disclaimer:
- The view expressed here is my personal view
- Any decision you take, you need to take responsibility for the same
- It's your hard earned money. Treat it wisely
- Trade / Invest keeping in mind your trading style, goals and objectives, time horizon & risk tolerance
-- Do your own analysis and consult your financial adviser if needed
