NIFTY - 12-02-2025Yesterday, Nifty 50 saw a sharp decline of 300 points, driven by heavy selling in overvalued small-cap stocks with weak earnings. The index formed a long bearish candle, indicating a shift in support levels down to 22,700.
For today, the market is expected to remain range-bound, with premiums declining on both sides, particularly on call options.
NIFTY trade ideas

#Nifty directions and levels for February 12th:Good morning, Friends! 🌞
Here are the market directions and levels for February 12th:
Market Overview
There have been no significant changes in the global or local markets. The global market continues to maintain a bullish sentiment (as indicated by the Dow Jones), while the local market is showing a moderately bearish sentiment. Today, the market may open with a neutral to slight gap-up, as the GiftNifty indicates a positive sign of 60 points.
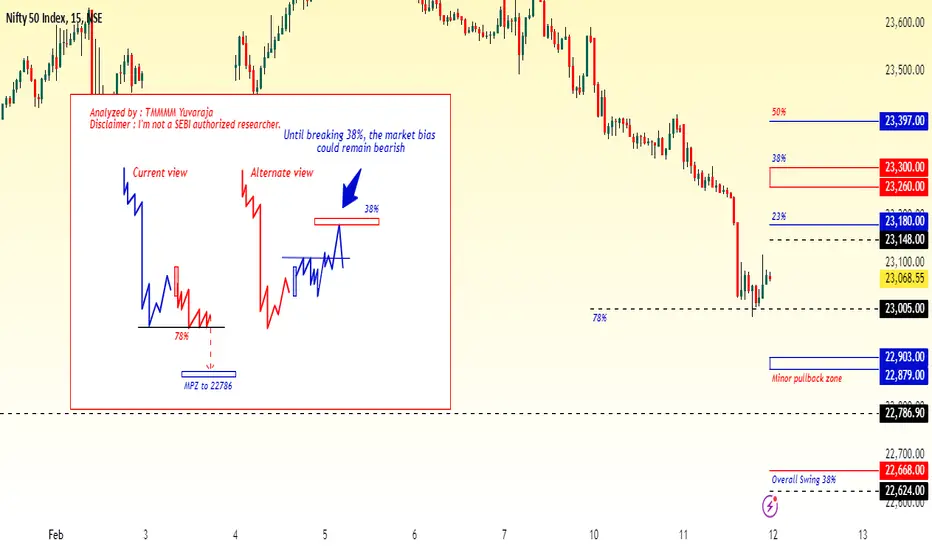
In the previous session, both Nifty and Bank Nifty fell drastically, but by the end of the session, they could take a minor pullback. What about today? The structure seems to have a bearish bias. If the gap-up doesn't sustain, we can expect a continuation of the correction when it breaks the previous day's low. On the other hand, if the gap-up sustains, it could consolidate between the previous day's low and the 38% mark. This is the basic structure; let's look at the charts.
We are following the same sentiment we observed in the previous session. Today as well, both Nifty and Bank Nifty have similar structures.
Nifty Current View:
The current view suggests that based on the structure, the gap-up may not sustain. If the market starts to decline, it could reach a minimum of 22,903 once it breaks the previous day's low. After that, if it consolidates or breaks this level, we can expect a continuation of the correction. On the other hand, if it finds support there, it could take a maximum pullback of 23% to 38% in the minor swing. Structurally, this pullback has a lower probability.
Alternate View:
The alternate view suggests that if the market sustains the gap-up, it could reach a minimum of the 23% to 38% mark. However, the 38% level is a major resistance level. If the market rejects this level, it may consolidate between the 38% and the previous day's low with a bearish bias. However, if the market breaks the 38% level with a strong candle or after some minor consolidation, it could reach the 50% level.
Nifty buy above 23130 sell below 23020 , both side move possibleHow to take trades using Harmonic pattern projection Trade setup is explained below :-
1st D point : 0% is recent top or bottom.
Trailing SL: 17.5% is work as trailing SL of buy or sell trade if hit then we have to book profit
.If price goes below 17.5% then early or risky traders can reversal trade ,
Targets :
Target T1 : 28.3%
Target T1 : 37.8 %
Target T3 : 48.1%
T3: 60.2% to 66.9 % is our 3rd Target since this is reversal zone so must book profit if break then take fresh trade again
Next Targets are 77.5 % , 89.6 % 100% , 113.5 % , 127.3% , 141.2% and 160.2 , 177.5. final Target 200%
160.2 to 177.5% if profit booking area so book full profit and wait for reversal.
How to take reversal trade :
If price going upside/ downside then then buy or sell levels appear on Chart ( Automatically show when price reach any reversal zone of harmonic projection pattern based .
After showing reversal levels wait for confirmation until 17.5 % or 28.3 % level not break if break then exit from current buy / sell trade and take fresh reverse trade buy/ sell .
Trailing SL:
After reach 1st Target trail SL to just above or below cost ( for example we are holding sell trade from 100 1st Target 110 hit then move trailing sl to 104-105 and move SL as price move upside or Downside)
Blue Line is 1st support/ Resistance
Green line is 2nd support/ resistance
Red line is 3rd Support/ resistance

NIFTY Levels for February 12, 2025NIFTY Levels for Today
Here are the today's NIFTY Levels for intraday. Based on market movement, these levels can act as support, resistance or both.
Please consider these levels only if there is movement in index and 15m candle sustains at the given levels.
The SL (Stop loss) for each BUY trade should be the previous RED candle below the given level. Similarly, the SL (Stop loss) for each SELL trade should be the previous GREEN candle above the given level.
Note: This idea and these levels are only for learning and educational purpose.
Your likes /boosts gives us motivation for continued leaning and sharing ideas.

NIFTY Trading Strategy for 12th February 2025📊 NIFTY Trading Strategy – 15-Min Time Frame 🏅
📌 Key Levels for 15th February 2024
🔹 Long (Buy) Setup:
Entry Above: 23,190
Target 1: 23,230
Target 2: 23,295
Target 3: 23,350
Stop Loss: Below 23,150 (or as per your risk management)
🔻 Short (Sell) Setup:
Entry Below: 22,960
Target 1: 22,918
Target 2: 22,872
Target 3: 22,835
Stop Loss: Above 23,000 (or as per your risk management)
📍 Trading Notes & Strategy:
✅ Use a 15-minute time frame for confirmation.
✅ Wait for a clear breakout or breakdown before entering trades.
✅ Consider volume analysis and price action to validate entries.
✅ Adjust stop-loss and targets based on volatility and market conditions.
✅ Implement proper risk management—never risk more than you can afford to lose.
⚠️ Disclaimer: I am Not SEBI Registered.
This analysis is for educational and informational purposes only and does not constitute financial advice. Trading in stock markets involves significant risk, and past performance is not indicative of future results. Always conduct your own research, use appropriate risk management strategies, and consult with a certified financial advisor before making trading decisions. Trade at your own risk.

Nifty View for 12 FebGapup open expected,
Hence, Short position would be preferable as per the falling wage has been formed.
Entry at 23259.20
SSL at 23363.00
Target at 23075_23055
Rest the mkt is supreme boss...😊

What is macd and how to use it in trading ?Moving average convergence/divergence (MACD) is a technical indicator to help investors identify entry points for buying or selling. The MACD line is calculated by subtracting the 26-period exponential moving average (EMA) from the 12-period EMA. The signal line is a nine-period EMA of the MACD line.
Key Tips for Using the MACD Histogram:
Rising Bars Above Zero: Strong bullish momentum.
Falling Bars Above Zero: Weakening bullish momentum.
Rising Bars Below Zero: Momentum is still bearish but weakening.
Falling Bars Below Zero: Strong bearish momentum.

what is DATABASE trading and how to do it ?It provides real-time information about stock and market prices as well as historical trends for assets such as equities, fixed-income products, currencies and derivatives. Step 1: Establishing the Baseline. Start by understanding the macroeconomic context. ... Step 2: Analyzing the Surprise Factor.
Trading involves the buying and selling of financial assets, such as stocks, to earn profits based on the price fluctuations of these assets. There are different types of trading, and traders use various strategies, techniques, and tools to decide when to buy or sell different assets

Nifty 50 Intraday Technical Analysis for 12th Feb., 2025🚀 Unlock the potential with my Nifty 50 Intraday Technical Analysis for 12th Feb., 2025!
✨ Boost, follow, and engage for updates. Your support means a lot! 🚀❤️
📍 Day Range Trigger Point (DRTP): 23072
📅 Expected Day Range: 403
📈 Long Position
🔹 Buy Above: 23236
🎯 Target 1: 23321
🎯 Target 2: 23475
⛔ Stoploss: 23101
📉 Short Position
🔹 Sell Below: 23141
🎯 Target 1: 22823
🎯 Target 2: 22668
⛔ Stoploss: 23275
✨ My strategies are backed by 6+ years of research and proven success in trading indices, commodities, and more. Connect to know more for Intraday Levels and Live Market Confirmations. 📈
#Nifty50 #IntradayTrading #NumroTrader 🚀

How to trade profitabily in stock markets???Use strategies like scalping or momentum trading, aiming for small, consistent gains across several trades. Set realistic profit targets and strict stop-losses to limit risk. Always start with a small capital, trade with proper risk management, and avoid over-leveraging to protect your investments.
Scalping is one of the most popular strategies. It involves selling almost immediately after a trade becomes profitable. The price target is whatever figure means that you'll make money on the trade. Fading involves shorting stocks after rapid moves upward.

NIFTY- Intraday Levels - 12th February 2025If NIFTY sustain above 23087 above this bullish around 23153 above this more bullish then 23243 then 23283 to 23294 then hold.
If NIFTY sustain below 22982 very strong level below this bearish then 22893 to 22880 below this more bearish then around 22852 then wait.
My view (for your study and analysis only, also conside my analysis could be wrong and to safegaurd the trade risk management is must) Probably buy on dip, can we expect a relief rally or bounce or market movers to add more short position for next 1-2 days before market heads towards 22666?
Consider around 50 points buffer or SL.. .. sorry its expire day after a huge one side movement
Please do your due diligence before trading or investment.
**Disclaimer -
I am not a SEBI registered analyst or advisor. I does not represent or endorse the accuracy or reliability of any information, conversation, or content. Stock trading is inherently risky and the users agree to assume complete and full responsibility for the outcomes of all trading decisions that they make, including but not limited to loss of capital. None of these communications should be construed as an offer to buy or sell securities, nor advice to do so. The users understands and acknowledges that there is a very high risk involved in trading securities. By using this information, the user agrees that use of this information is entirely at their own risk.
Thank you.

Nifty still going Down? Application of Elliott waves and FiboNSE:NIFTY has corrected by 3500 pts (13.3%) from its high of 26,277 in Sep’24.
In post COVID era this is the 2nd biggest correction in terms of % and biggest in points.
Let us use Elliot wave theory and the Fibonacci retracement tool
Wave Time Start to End Points (percentage from top)
Wave (X) ( (i) to (ii) ) Oct-21 to Jun-22 18,604 to 15,183 3,421 pts (18.4%)
Wave Y ( iii to iv ) Sep-24 to Feb-25 26,277 to 22,986 3,290 pts (13.28%)
Wave Z ( I to ii ) Dec-22 to Mar-23 18,887 to 16,828 2,059 pts (10.79%)
Wave (X) ≈ Wave Y || 3421 ≈ 3290 (Δ4%)
Wave Y ≈ 168% * Wave Z || 3290 ≈ 161.8%*2059 (i.e. 3331) (Δ1%)
*In stock market waves will hardly be exactly equal, 5% of deviation is acceptable to me.
While Wave Y & Z are of same degree, wave (X) is of higher than these two.

Nifty trades and targets for - 12/2/25Hello Everyone. The market was in a bearish mode today. If the market opens flat then we can see continuation of trend. If it opens gap up then we need to see the resistance level to break before looking for CE trades. If it opens gap down then look for PE trades after support zone is broken. Let the market settle in first 15 to 30 minutes then look for directional trades. Book profits every 40 points as we are getting very few trending moves.

Nifty - Hope for a recovery but sadly hope is not a trade.Traders lost 9L Cr today in markets free fall.
A few known reasons -
- Rupee depreciation & FII selling
- US imposition of tariffs
- Weakening sentiments
A few unknown reasons -
- No one knows!
What's next? Good time to buy now? Let the video explain.

Nifty long term Elliot waves..Updating long term wave counts. Corrective wave (iv) is still going on. however 22800 level seems to be showing good buying interest.
Further impulse wave is (v) which may start in mid March. Upcoming waves marked are only for reference purpose. Levels have to be calculated based on completion of (iv)

Flag and Pole chart...Nifty 50 on its journey of 37000I am sure many are worried to see the Nifty fall from 26200 levels to current levels of 23070.
Many will be tempted to exit their stocks and portfolio. However I think if you are having good fundamental stocks then you must tightly hold on to your stocks. If you have money, then add more of your stocks at current levels. Here is the reason why..
Nifty 50 had a 12 year trendline breakout in Nov 2021. From the bottom of March 2020 to this Nov 2021 breakout, it was a flag and pole chart. We can see how the flag breakout has unfolded in next 3 years. Nifty has again done a flag and pole from its June 2022 lows to Sept 2024 peak. A break of this point means another 11000 points from 26200. So in all probability in next 3 years we can see Nifty 50 at 37000 levels. When exactly this breakout will happen cannot be predicted. But surely this breakout is coming. Below is the reason, why I think this will happen.
We all know India is the fastest growing country in GDP. This will reflect in stock market growth also. We have only 4 Cr Investors in MF. Current monthly SIP book is 25000 Cr. When we double or triple the MF investors, the SIP as well as Lumsump inflows is likely to double and triple. We have 18.5 Crore demat accounts and we are adding an average rate of 38 lakhs demat every month. We have 65% people in India below the age of 35 and 50% below the age of 25. Just see the growth that these people will bring in next 10 to 20 years. It's a mega opportunity of Aspirational India. So don't get carried away by seeing your portfolio in loss. In fact if you had invested even before the Covid fall when Nifty was around 12400 and you had not sold during covid fall, still your portfolio will be doubled in these 5 years. This is 14.4% CAGR. If we continue with the same CAGR, then Your 10 lakhs Portfolio of Jan 2020 will be 1.37 Crore in 2040. So don't carried away by the noise in the market about corrections and hold on to your good fundamental stocks. Ofcourse do review your stock portfolio. Not every stock is going to fetch you 10X in 20 years. Some will give you more, some will give you less and some will erode your capital.

Nifty Return on Triangle 11/02/2025Timeframe : Daily , Exchange : NSE Symbol : Nifty50 Index : I Was predated on 04/02/2025 nifty false breakout and wait for direction. Today Nifty return to triangle. If down support line breakout then next support level is 21775

Nifty Intraday Analysis for 11th February 2025NSE:NIFTY
Index closed near 23380 level and Maximum Call and Put Writing near CMP as below in current weekly contract:
Call Writing
24000 Strike – 121.73 Lakh 23700 Strike – 84.58 Lakh
23600 Strike – 73.33 Lakh
Put Writing
23000 Strike – 52.32 Lakh
23100 Strike – 45.96 Lakh
23300 Strike – 36.68 Lakh
Index has resistance near 23550 - 23600 range and if index crosses and sustains above this level then may reach near 23750 - 23800 range.
Index has immediate support near 23200 – 23150 range and if this support is broken then index may tank near 23000 – 22950 range.

Nifty levels - Feb 12, 2025Nifty support and resistance levels are valuable tools for making informed trading decisions, specifically when combined with the analysis of 5-minute timeframe candlesticks and VWAP. By closely monitoring these levels and observing the price movements within this timeframe, traders can enhance the accuracy of their entry and exit points. It is important to bear in mind that support and resistance levels are not fixed, and they can change over time as market conditions evolve.
The dashed lines on the chart indicate the reaction levels, serving as additional points of significance to consider. Furthermore, take note of the response at the levels of the High, Low, and Close values from the day prior.
We hope you find this information beneficial in your trading endeavors.
* If you found the idea appealing, kindly tap the Boost icon located below the chart. We encourage you to share your thoughts and comments regarding it.
Wishing you success in your trading activities!

Nifty forming a falling wedgeNifty is currently forming a falling wedge pattern, with key support at 22,600 . If this level holds and a bounce occurs, a breakout on the upside is likely, with 23,300 acting as a major resistance.
The crucial levels to watch are 22,600 on the downside and 23,300 on the upside . A breakdown below 22,600 with high volumes could trigger further selling, pushing Nifty towards 21,700–21,200 . Conversely, a breakout above 23,300 with strong volumes and sustained momentum would signal the end of the correction. These levels will be decisive for Nifty’s next move.

Sensex hero zero setupThe market has formed support as below—Sensex 76400 hero zero trade. Entered at - 30 Target - 200.

Why Traders Ignore Stop-Losses—and How to Fix It Why Traders Ignore Stop-Losses Despite Knowing They Should:
The concept of a stop-loss is one of the first things every trader learns. Yet, many fail to follow it when it matters the most. Ironically, the very tool designed to protect capital is often ignored, leading to massive drawdowns or even account wipeouts.
But why does this happen? If traders understand that stop-losses are crucial, what stops them from executing them?
In this article, we’ll dive deep into the psychological and behavioral reasons behind this phenomenon.
1. The Illusion of Control
Many traders believe they have more control over the market than they actually do. They think,
“The price will bounce back soon.”
“I can handle this drawdown.”
“Let me just wait a little longer.”
This false sense of control leads to hope-based trading rather than rule-based trading. The market, however, doesn’t care about personal expectations.
How to Fix It?
Accept that no one can control the market.
Focus on controlling your reaction, not the outcome.
Set stop-loss orders in advance to prevent emotional interference.
2. The Pain of Being Wrong
Taking a loss feels like admitting defeat. No one likes being wrong, and in trading, a stop-loss confirms that your analysis was incorrect. This leads to a dangerous mindset shift:
“If I don’t sell, I haven’t lost yet.”
“I’ll wait for a reversal so I don’t have to accept failure.”
This refusal to accept small losses often results in bigger losses, trapping traders in hope mode rather than risk management mode.
How to Fix It?
Shift your mindset: A stop-loss is not failure; it’s a business expense.
Track your trades and review them objectively. Did following your stop-loss prevent bigger losses?
3. Anchoring Bias: The Entry Price Obsession
Traders often anchor themselves to their entry price instead of current market conditions. If a stock was bought at ₹500 and falls to ₹480, the trader still sees ₹500 as the "real" value. This prevents them from accepting the loss and moving on.
But markets don’t care about your entry price. They move based on supply and demand, not personal expectations.
How to Fix It?
View every trade as an independent event, not a battle to win back losses.
Ask yourself: If I were entering fresh, would I still buy this?
4. Overconfidence and Revenge Trading
Some traders, especially those who had a series of winning trades, start believing they are invincible. They stop respecting stop-losses, thinking:
“I can always recover.”
“The market has to move in my favor.”
This overconfidence often turns into revenge trading, where traders double down to recover losses quickly, leading to even bigger drawdowns.
How to Fix It?
Respect risk management at all times, regardless of recent success.
Use a fixed risk percentage per trade to avoid emotional trading.
5. The "One Last Chance" Mentality
Many traders move their stop-loss further away instead of exiting, hoping for a last-minute reversal. This often results in:
✅ Small losses turning into big losses.
✅ Account drawdowns that are hard to recover from.
How to Fix It?
Never move your stop-loss in the wrong direction.
Follow a pre-defined exit plan before entering a trade.
6. The Fear of Missing Out (FOMO)
Some traders remove stop-losses because they fear getting stopped out right before the price moves in their favor. But this is a part of trading. No strategy has a 100% win rate.
How to Fix It?
Understand that stopping out is part of the game.
Instead of fearing losses, focus on your overall risk-reward ratio.
Conclusion: Following Stop-Losses is a Skill, Not Just a Rule
Ignoring stop-losses is not a technical problem; it’s a psychological one.
Successful traders understand that losses are an inevitable part of the game. The key is to:
✅ Detach emotions from trading decisions.
✅ Accept small losses as the cost of business.
✅ Follow a disciplined risk management plan.
If you’re still struggling with following stop-losses, ask yourself:
"Am I here to win trades, or am I here to make money?"
The best traders protect their capital first. Everything else follows.

Zone of DismayIf you look at the charts it has clearly broken the crucial support of 23332 which was the last years 03 June 2024 high which was the one of biggest spinning days. So markets are now in big selling mode and the parallel channel was formed making 6 touchdowns around the level of 23332 and that's the biggest issue as of now.
On precise levels the markings are made on the chart indicating the further support and resistance coming ahead timespan.
I felt that another major reason for such weakness is the Gold and other commodities rally which is very sharp and Black gold is sluggish and till the US Administration is not clear what they want from global economies markets will remain in sideways to bearish mode.
