Nifty - Elliot Wave Date : 15.02.2025
Nifty Spot
Timeframe : Day chart
Nifty is under corrective phase & i have plotted internal waves for people's learning & understanding.
Regards,
Ankur
NIFTY trade ideas

Nifty - Expiry day analysis Feb 20Price was moving in a range for the past few days and in that process has created a channel pattern. Also I can see a triangle inside the channel.
Buy above 22920 with the stop loss of 22880 for the targets 22960, 23000, 23040, 23100 and 23160.
Sell below 22840 with the stop loss of 22880 for the targets 22800, 22760, 22700 and 22660.
As per daily chart price is at support.
Always do your own analysis before taking any trade.

Nifty levels - Feb 24, 2025Nifty support and resistance levels are valuable tools for making informed trading decisions, specifically when combined with the analysis of 5-minute timeframe candlesticks and VWAP. By closely monitoring these levels and observing the price movements within this timeframe, traders can enhance the accuracy of their entry and exit points. It is important to bear in mind that support and resistance levels are not fixed, and they can change over time as market conditions evolve.
The dashed lines on the chart indicate the reaction levels, serving as additional points of significance to consider. Furthermore, take note of the response at the levels of the High, Low, and Close values from the day prior.
We hope you find this information beneficial in your trading endeavors.
* If you found the idea appealing, kindly tap the Boost icon located below the chart. We encourage you to share your thoughts and comments regarding it.
Wishing you success in your trading activities!

Nifty Weekly Analysis for 24-02-25 to 28-02-25Nifty Weekly Analysis for 24-02-25 to 28-02-25
22700-23200 is the sideways range for nifty next week.
If Nifty sustains above 23200, more upside possible and targets are 23480/23780.
If Nifty trades below 22650, more downside possible and targets are 22500/22360.

Nifty Under Stress: Will 22,800 Support Level Hold?● The Nifty is currently trading near its immediate support zone around the 22,800 level.
● The open interest data reveals a notable surge in call OI at the 22,800 strike price, with call OI increased by 38 lakh shares in the last trading session.
● On the other hand, put OI also rose by 20 lakh.
● This activity suggests strong support at the 22,800 level, indicating it is unlikely to be breached easily in the near term.
● However, a break below this support level could lead to a downward move toward the 22,500 level.
● In the current scenario, the market is expected to remain range-bound and choppy in the upcoming week.


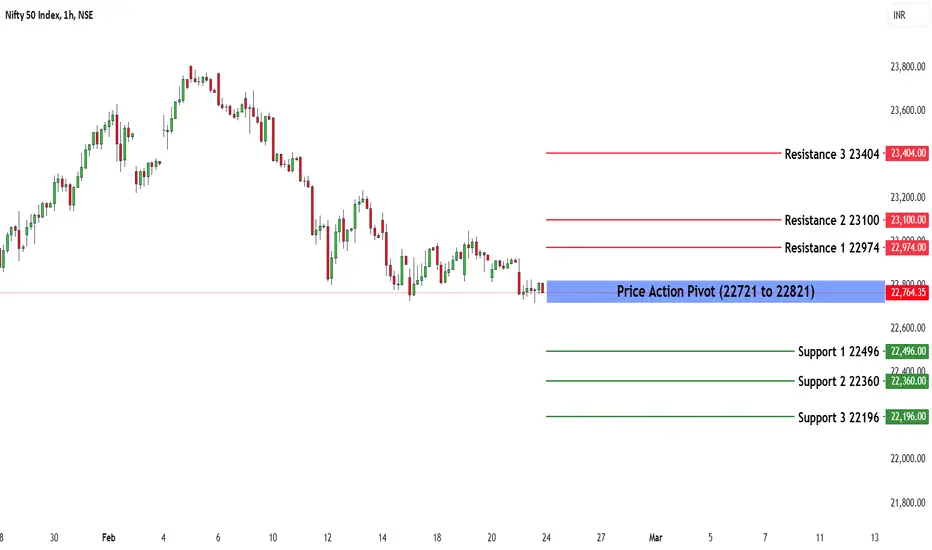
Nifty 50 Weekly Analysis: Key Levels & Trend OutlookWeekly Recap:
The Nifty 50 closed the week at 22,795.90, marking a significant decline of -0.51%. The bearish momentum dominated the market, pulling the index lower as selling pressure intensified.
Key Weekly Levels for Next Week
Price Action Pivot Zone:
The crucial zone to watch for any potential reversals or trend continuation is between 22,721 - 22821.
Support & Resistance Levels:
Support Levels:
S1: 22,496
S2: 22,360
S3: 22,196
Resistance Levels:
R1: 22,974
R2: 23,100
R3: 23,404
Market Outlook:
Bullish Scenario: A sustained move above 22,821 and strength beyond 23,100 could attract buyers, leading to a possible retest of R1 at 23,234 and beyond.
Bearish Scenario: If 22,721 fails to hold, the market could witness further selling, driving Nifty towards S1 at 22,496 and possibly lower.
NIFTY MATHEMATICAL LEVELS These Levels are based on purely mathematical calculations.
Validity of levels are upto expiry of current week.
How to use these levels :-
* Mark these levels on your chart.
* Safe players Can use 15 min Time Frame
* Risky Traders Can use 5 min. Time Frame
* When Candle give Breakout / Breakdown to any level we have to enter with High/Low of that breaking candle.
* Targets will be another level marked on chart
* Stop Loss will be Low/High of that Breaking Candle.
* Trail your SL with every candle.
* Avoid Big Candles as SL will be high then.
* This is one of the Best Risk Reward Setup.
For Educational purpose only

Nifty 50 spot 22795.90 by the Daily Chart viewNifty 50 spot 22795.90 by the Daily Chart view
- Nifty 50 Index 22775 to 22950 Support Band is yet sustained
- Long shot deep Support Zone seen at 22125 to 22350 which for now seems bit (un)likely by current technical chart status setup
- Just a flag to highlight : Nifty Index had dipped up to 22720 in recent past few days and similar levels was Resistance Level in April 2024 for 23K Index target
- Few of the Gap Ups and Gap Down openings, yet are remaining to get closed and filled in below the Old Long Shot Support Zone at 22125 to 22350 for Nifty Index levels

Nifty intraday key levels for 21.02.25Hi,
* Please mark the levels in your chart and get prepared for 21.02.25 - Index Intraday Trading
* These Support and Resistance levels have good accuracy.
Resistance zone
R1 23040 - 23080
R2 23180 - 23220
Support zone
S1 22840 - 22800
S2 22700 - 22640
Regards
Bull Man

Elliott Wave Analysis: Nifty’s Final Corrective Leg UnfoldingOn October 31, I predicted that Nifty would enter a bearish phase based on my Elliott Wave Zigzag analysis. So far, the market has followed this pattern.
Currently, Nifty is in the final leg of its corrective phase. After reaching the 22,500–22,300 range, I expect it to complete its 5th corrective wave. The structure has played out in three key phases:
First Zigzag Pattern: Waves (i), (ii), (iii), (iv), (v)
ABC Correction Phase: A, B, C
Final Zigzag Pattern: Waves (i), (ii), (iii), (iv), (v)
As per my analysis, Wave (V) is close to completion, but some time correction is still pending, while the price movement has mostly aligned with expectations. Keep an eye on market signals for confirmation!

NIFTY analysis based on Elliott Wave theoryNIFTY is looking like in wave (Z).
Now, wave (Z) is always in 3 moves (ABC).
If we take a look in 75 min chart of NIFTY, we may see wave (a) of wave (Z) finished on 12 Feb. The price is in wave B of wave (b) now.
It looks like Zig-zag pattern is forming and it is observed most of the times that, Wave B of Zig-zag takes at least equal time of wave A.
So we may assume that, wave (b) of Zig-zag will finish at least by 19 Feb near 50% to 61.8% And then we may expect a fall to form wave (c) of Zig-zag.
This analysis is based on Elliott Wave theory and Fibonacci.
This analysis is for educational purpose only.

Nifty Intraday Analysis for 21st February 2025NSE:NIFTY
Index closed near 22915 level and Maximum Call and Put Writing near CMP as below in current weekly contract:
Call Writing
23500 Strike – 99.20 Lakh 23000 Strike – 77.10 Lakh
23200 Strike – 48.98 Lakh
Put Writing
23000 Strike – 72.73 Lakh
22500 Strike – 56.08 Lakh
22800 Strike – 43.86 Lakh
Index may reach 23150 - 23200 range, if crosses and sustains above 23050 level. Further, Index may reach 23300 - 23350 range, if sustain above 23100 level.
Index has immediate support near 22800 – 22750 range and if this support is broken then index may tank near 22650 – 22600 range.

Nifty trades and targets for - 24/2/25Hello Everyone. The market was in a bearish mode. If the market opens flat then we can see continuation of trend. If it opens gap up then we need to see the resistance level to break before looking for CE trades. If it opens gap down then look for PE trades after support zone is broken. Let the market settle in first 15 to 30 minutes then look for directional trades. Book profits every 40 points as we are getting very few trending moves.

Nifty trades and targets for - 26/2/25Hello Everyone. The market was in a very tight range the previous day. Let the resistance or support range break with 15-minute candle before going for any trades. If we do trades in between these zones premium eating will happen and we end up seeing losses. Book profits every 30 points as we are getting very few trending moves. If the market opens flat then we can see continuation of trend. If it opens gap up then we need to see the resistance level to break before looking for CE trades. If it opens gap down then look for PE trades after support zone is broken. Let the market settle in first 15 to 40 minutes then look for directional trades.

SEBI’s Proposed Tightening of Derivatives Market RulesWhat is SEBI Trying to Do?
SEBI (Securities and Exchange Board of India) has proposed stricter regulations on the derivatives market, which includes stock and index futures & options. This move comes amid growing concerns about retail traders losing money due to high volatility and leverage in derivatives trading.
Key Changes Proposed by SEBI
1️⃣ Position Limits for Single Stock Derivatives
SEBI wants to cap the number of derivative contracts traders can hold for certain stocks.
The limit will be based on a stock’s market cap and daily traded volume.
This could reduce speculation and volatility in individual stocks.
2️⃣ Stricter Rules for Index Derivatives
Currently, traders can trade Nifty and Bank Nifty derivatives easily.
SEBI wants to introduce eligibility criteria so only fundamentally strong indices can have derivatives.
This may impact liquidity and the number of available trading instruments.
3️⃣ Pre-Open Trading Session for Futures
Just like in the cash market, SEBI wants a pre-open session for futures.
This could reduce gap-ups and gap-downs, making trading more stable.
Why is SEBI Doing This?
📉 Retail Traders Are Losing Money – Many new traders enter the market without experience, leading to heavy losses in options trading.
📊 Market Stability – Reducing excessive speculation will prevent stock price manipulation.
💰 Foreign Investment Confidence – Stricter rules can attract more institutional investors by making the Indian market more predictable.
How Will This Impact Traders?
✔️ Option Buyers and Sellers: Limited position sizes may reduce liquidity, affecting option pricing and spreads.
✔️ Intraday Traders: Changes in derivatives rules might lead to lower volatility, affecting momentum-based strategies.
✔️ Institutional Investors: Stricter rules could make Indian markets more attractive to foreign investors.
Trading Strategies Post-SEBI Changes
Focus on Cash Market Stocks: If derivative trading becomes restrictive, more money might flow into quality stocks.
Adapt to New Position Limits: Traders should carefully manage risk if new limits are imposed.
Use Hedging Strategies: If index derivatives face restrictions, hedging with ETFs and sectoral indices might become more important.

what is RSI and Rsi divergence ?**RSI (Relative Strength Index)** is a popular technical indicator used in financial markets, primarily to assess the strength or momentum of a security's price movement. It was developed by J. Welles Wilder in the late 1970s.
- **RSI Calculation:** The RSI ranges from 0 to 100 and is typically calculated using 14 periods (though it can be adjusted). The formula compares the magnitude of recent gains to recent losses in price movement, essentially measuring how overbought or oversold an asset might be.
- RSI = 100 - (100 / (1 + RS)), where **RS** is the average of "up closes" divided by the average of "down closes" over the given period.
**Key Levels to Watch:**
- **Overbought:** RSI above 70 typically suggests the asset might be overbought and could face a price reversal or pullback.
- **Oversold:** RSI below 30 typically suggests the asset might be oversold and could experience a price reversal upward.
---
**RSI Divergence** occurs when there is a discrepancy between the price movement of an asset and the movement of the RSI.
- **Bullish Divergence:** This happens when the price forms lower lows, but the RSI forms higher lows. It suggests that despite falling prices, the downward momentum is weakening, indicating a potential upward reversal or trend change.
- **Bearish Divergence:** This happens when the price forms higher highs, but the RSI forms lower highs. It suggests that despite rising prices, the upward momentum is weakening, indicating a potential downward reversal or trend change.
### Example:
- **Bullish Divergence:** Imagine a stock price makes a new low, but the RSI makes a higher low. This divergence could signal a buying opportunity as the stock might be oversold and due for a bounce.
- **Bearish Divergence:** If a stock price makes a new high, but the RSI forms a lower high, it may signal a potential selling opportunity because the buying momentum is weakening, and a price drop could be imminent.
RSI divergence is considered a potential signal, but it's often more reliable when used in conjunction with other technical indicators or chart patterns to confirm a potential reversal.

IS Nifty going to go down tomorrow to make Wave 5 ?Nifty has been in a correction mode ( for the current wave),
from 4 feb 25 ( from which we are wildly trying the Elliot Wave).
The wave ( IV ) seems being made already ? at 23052, which
can be our invalidation line for this suggestion ! that means if
price is going further up and ignores making of (IV), then our
complete assumptions to make the Elliot wave was wrong .
Today market opened gap down at 22850ish. and it has not
shown the speed to go up and break.
If this Elliot wave drawing is proper, then can the market see
a gap down tomorrow ? and then similar to today, as market went
down and came up, similarly, can we expect same tomorrow ?
And if the values go down , should we expect 22700ish value down ?
And we expect market to go up for few days from day after tomorrow ( how many days , we will make a post for that :)) ? if market does not go
up from tomorrow + Day after tomorrow, then expect a long down
movement.
Let us expect a reason and news for the market to correct and
then come up.
So what will happen day after tomorrow ? Naturally up if this holds correct !
Note : This is for educational purpose only. Assume that this is written for understanding market structure, and not for trading suggestion.

Nifty - Feb month expiry analysisPrice was moving within a range 22500 to 22620 for the past few days and unable to break it. 22500 is a strong support zone.
Buy above 22520 with the stop loss of 22480 for the targets 22560, 22600, 22660 and 22720.
Sell below 22460 with the stop loss of 22500 for the targets 22420,22380, 22320 and 22280.
Expected expiry day range is 22300 to 22600.
Always do your own analysis before taking any trade.

NIFTY Levels for February 25, 2025
NIFTY Levels for Today
Here are the today's NIFTY Levels for intraday. Based on market movement, these levels can act as support, resistance or both.
Please consider these levels only if there is movement in index and 15m candle sustains at the given levels.
The SL (Stop loss) for each BUY trade should be the previous RED candle below the given level. Similarly, the SL (Stop loss) for each SELL trade should be the previous GREEN candle above the given level.
Note: This idea and these levels are only for learning and educational purpose.
Your likes /boosts gives us motivation for continued leaning and sharing ideas.

Nifty bullish for this week!!!!!!! 23300!!!!As per my analysis price will retrace to 50% level(23300).
This week will be bullish.
But try to take a trade between monday and to close before monthly expiry.
If price went down from Monday ,then goo for 500 to 700 points in sell side for this week.
But former will likely to happen. I say it again this week will be massive movement.
Be ready and grab your setups.
This is not financially advice.
Learn to trade by yourself is better for you....

NIFTY Levels for February 21, 2025NIFTY Levels for February 21, 2025
NIFTY Levels for Today
Here are the today's NIFTY Levels for intraday. Based on market movement, these levels can act as support, resistance or both.
Please consider these levels only if there is movement in index and 15m candle sustains at the given levels.
The SL (Stop loss) for each BUY trade should be the previous RED candle below the given level. Similarly, the SL (Stop loss) for each SELL trade should be the previous GREEN candle above the given level.
Note: This idea and these levels are only for learning and educational purpose.
Your likes /boosts gives us motivation for continued leaning and sharing ideas.

NIFTY Predictions (wave pattern and Fibonacci study based)Hello everyone,
Nifty Almost bottom done spot 22550 closing before the elections in india now Nifty PE ratio is 20 which looks attractive undervalued. most probably till september-octber 2025 market going to break previous lifetime high its all for study purpose RSI is oversold
