How to Survive Gold Volatility During News Events?Hello Traders!
Gold is one of the most volatile instruments in the market, especially during big news events like US Fed announcements, inflation data, or geopolitical updates.
Many traders either get stopped out too early or end up chasing wild moves.
So how do you survive and trade smartly when g
Related futures
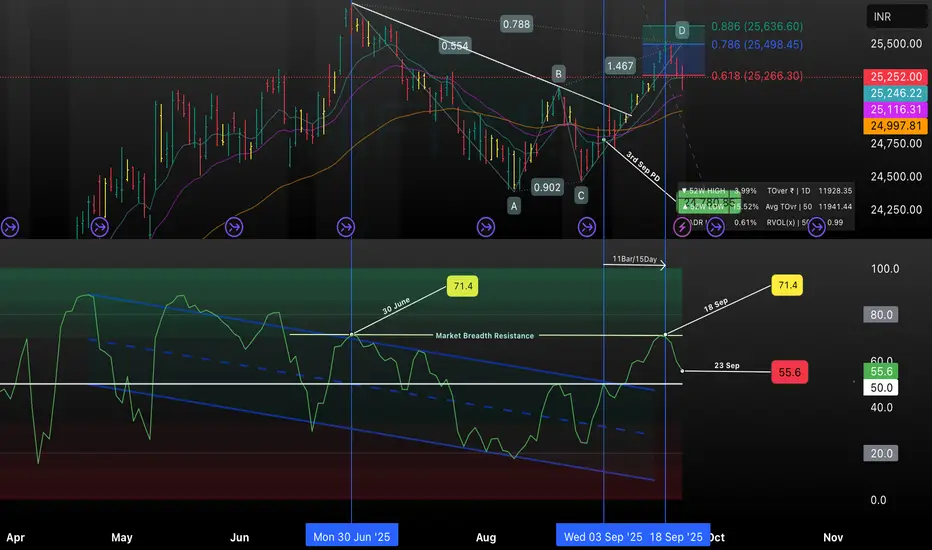
NIFTY 1D | Bearish Harmonic Pattern, RSI Rejection at ResistanceThis chart highlights a bearish harmonic setup forming on NIFTY’s daily timeframe, with key confluence at the 0.618 and 0.786 Fibonacci retracement levels. A descending trendline and ABCD points are marked, exposing short-term reversal probability. The RSI indicator shows clear rejection at the 71.4
" Path of least resistance is up" Lets catch the dip////???
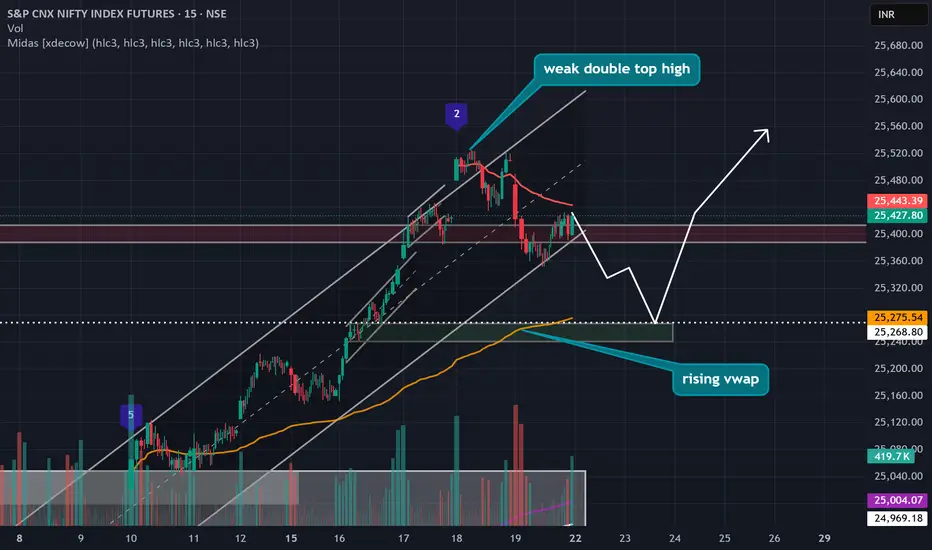
**NIFTY FUTURES - Weak Double Top Formation**
📊 **Current Setup:**
- Weak double top pattern identified near 25 500 levels
- Rising VWAP providing dynamic support from below
- Limited volume at recent highs suggesting weak resistance
🔍 **Key Observations:**
- The double top shows relatively weak
Nifty 50 Breakout and RSI Momentum Analysis – Sept 2025This TradingView chart presents a technical analysis of Nifty 50, highlighting a recent breakout from a descending trendline with harmonic ABCD pattern and advanced RSI insights. Key support and resistance levels are marked, and RSI momentum shows a clear structural shift as of September 17, 2025. T

Nifty 50 Breakout & Market Breadth Trend (Sep 2025) This chart highlights a Nifty 50 near-term breakout following a completed ABCD harmonic structure and rising market breadth levels into mid-September 2025. Key Fibonacci resistance zones are mapped, with price targets up to 25,500 based on the 0.786 and 0.886 extension levels. The market breadth ind

A HIDDEN CUP AND HANDLE ?this chart is nifty futures chart and as we can see that there is nearly a formation of cup and handle also it has not formed completely , lets see what nifty has for us in coming days and if it does breakout ??????

"Can we go long"???? why not????# 📊 NIFTY50 Daily Chart Analysis: Bearish Engulfing Pattern
## 🔍 Pattern Identification
**Bearish Engulfing Pattern** spotted on NIFTY50 daily chart - but let's dive deeper into the probability matrix!
## 📈 Statistical Edge
- **Standard Success Rate**: 70-72% with proper volume/RSI confirmation
-
Price Signals Weakness: Hints at Lower low formation on Daily TFThis week, Nifty has formed a distinctly bearish candle, indicating strong dominance by the sellers. This development suggests that the price action may be preparing for the formation of another lower low on the daily timeframe. The possible scenarios in line with this outlook have been discussed in

INFY 1D Time frame📊 Daily Snapshot
Closing Price: ₹1,484.65
Day’s Range: ₹1,476.50 – ₹1,502.70
Previous Close: ₹1,494.60
Change: Down –0.64%
52-Week Range: ₹1,307.00 – ₹2,006.45
Market Cap: ₹6.17 lakh crore
P/E Ratio (TTM): 22.62
Dividend Yield: 2.90%
EPS (TTM): ₹65.63
Beta: 1.09 (indicating moderate volati
nifty closing predictionsAs per chart patterns and technical indicators, there is a possibility that nifty will close lower today compared to the previous closing.
See all ideas
A representation of what an asset is worth today and what the market thinks it will be worth in the future.
Displays a symbol's price movements over previous years to identify recurring trends.
Frequently Asked Questions
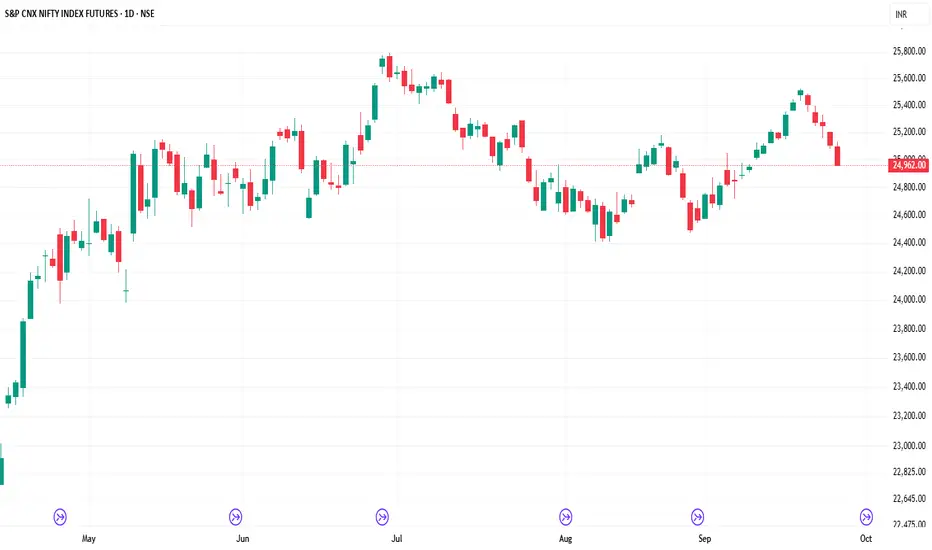
The nearest expiration date for S&P CNX NIFTY INDEX FUTURES is Jan 28, 2021.
Traders prefer to sell futures contracts when they've already made money on the investment, but still have plenty of time left before the expiration date. Thus, many consider it a good option to sell S&P CNX NIFTY INDEX FUTURES before Jan 28, 2021.