Nifty 50 Breakout and RSI Momentum Analysis – Sept 2025This TradingView chart presents a technical analysis of Nifty 50, highlighting a recent breakout from a descending trendline with harmonic ABCD pattern and advanced RSI insights. Key support and resistance levels are marked, and RSI momentum shows a clear structural shift as of September 17, 2025. T
Related futures

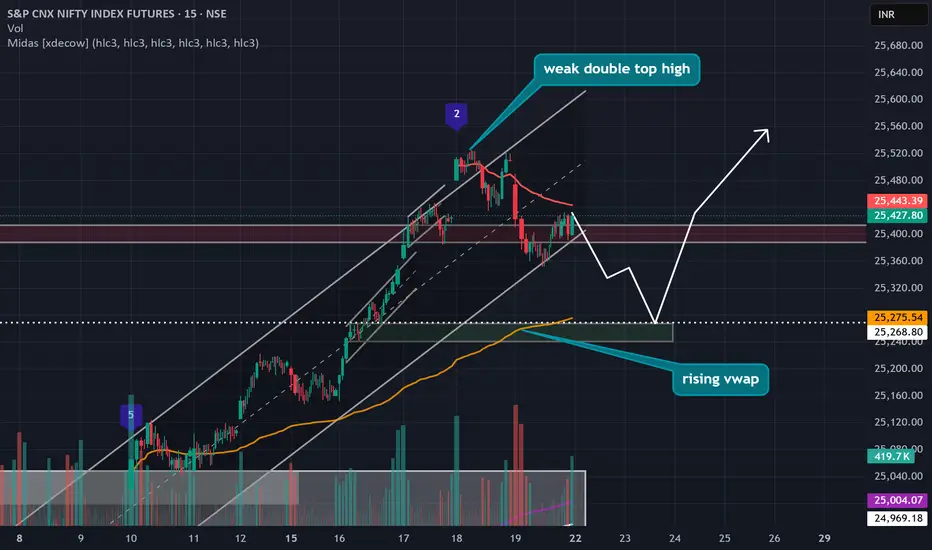
" Path of least resistance is up" Lets catch the dip////???
**NIFTY FUTURES - Weak Double Top Formation**
📊 **Current Setup:**
- Weak double top pattern identified near 25 500 levels
- Rising VWAP providing dynamic support from below
- Limited volume at recent highs suggesting weak resistance
🔍 **Key Observations:**
- The double top shows relatively weak
Nifty 50 Breakout & Market Breadth Trend (Sep 2025) This chart highlights a Nifty 50 near-term breakout following a completed ABCD harmonic structure and rising market breadth levels into mid-September 2025. Key Fibonacci resistance zones are mapped, with price targets up to 25,500 based on the 0.786 and 0.886 extension levels. The market breadth ind

A HIDDEN CUP AND HANDLE ?this chart is nifty futures chart and as we can see that there is nearly a formation of cup and handle also it has not formed completely , lets see what nifty has for us in coming days and if it does breakout ??????

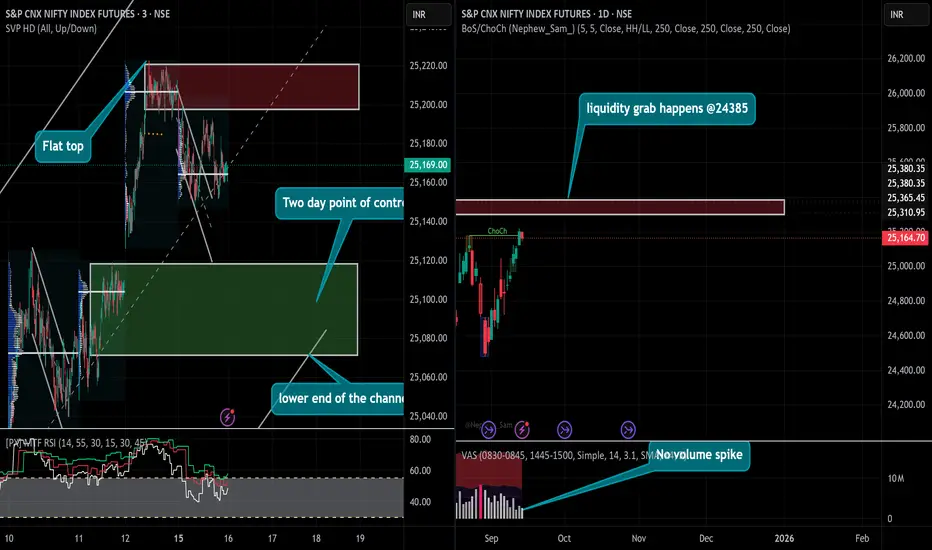
"Can we go long"???? why not????# 📊 NIFTY50 Daily Chart Analysis: Bearish Engulfing Pattern
## 🔍 Pattern Identification
**Bearish Engulfing Pattern** spotted on NIFTY50 daily chart - but let's dive deeper into the probability matrix!
## 📈 Statistical Edge
- **Standard Success Rate**: 70-72% with proper volume/RSI confirmation
-
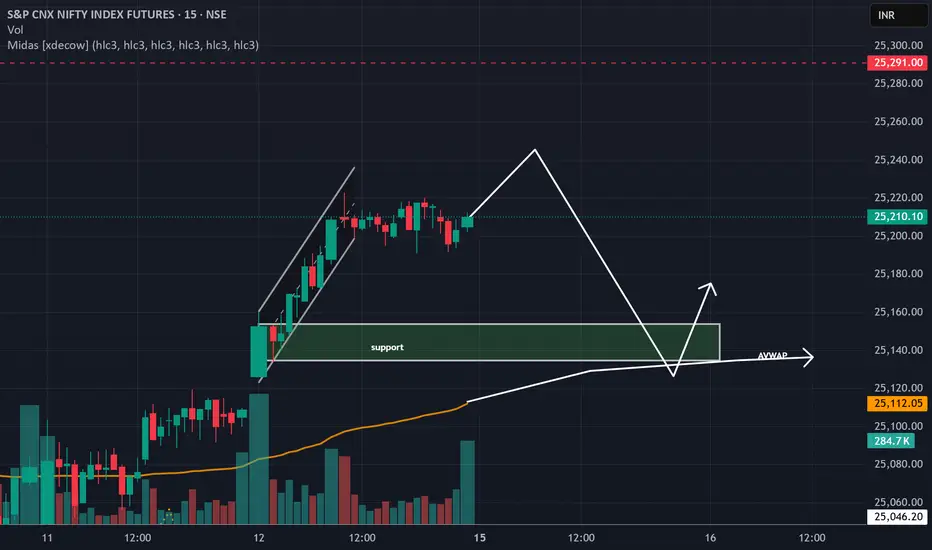
"Monday setup; Why Nifty may revisit 25120 zone"## 🎯 **Trading Scenario**
**IF** Nifty opens green on Monday and stays green until 10:40 AM:
### 📋 **Key Conditions to Watch:**
- ✅ Green opening sustained till 10:40 AM
- ❌ 25200 CE high of ₹60 should NOT be breached
- 📉 25200 CE price falls below ₹35 zone
### 🎯 **Expected Target:**
**Channel Lo
Physiology of Trading in the AI Era1. Human Physiology and Trading: The Foundations
1.1 Stress and the Fight-or-Flight Response
When humans trade, they are not just using rational logic; they are also battling their physiological responses. Every trade triggers an emotional and bodily reaction. For example:
Adrenaline release when

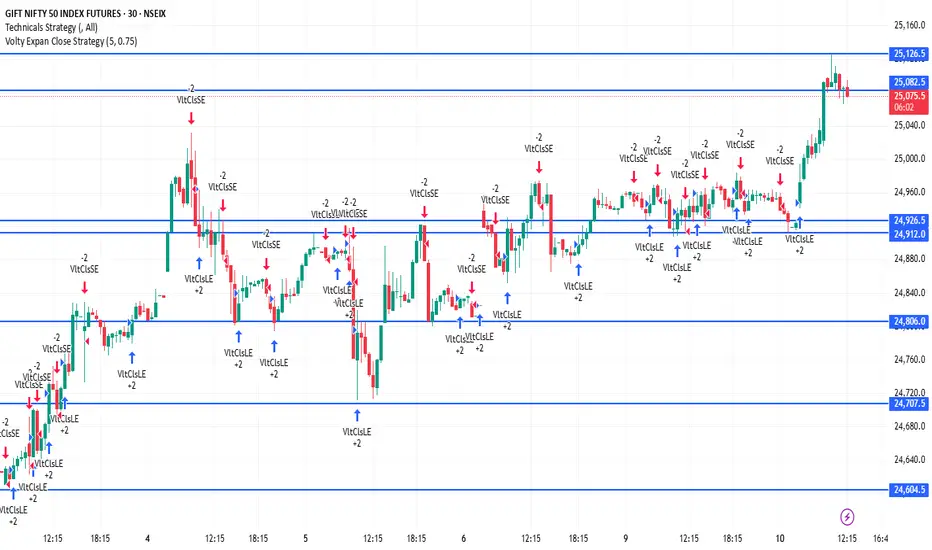
NIFTY1! 30Minutes Time frame📊 NIFTY1! – 30-Minute Timeframe (Current)
Current Price Zone: Approximately 25,092
🔻 Support Levels:
25,060 – Immediate support
25,020 – Stronger support zone
24,980 – Major support; breakdown here may lead to further weakness
🔺 Resistance Levels:
25,130 – Immediate resistance
25,180 – Stron
NIFTY1!📍 NIFTY1! – 1H Key Levels
🔹 Support Zones
22,450 – 22,500 → Immediate intraday support
22,350 – 22,400 → Stronger support, buyers likely active here
22,200 – 22,250 → Major support zone, breakdown can invite selling pressure
🔹 Resistance Zones
22,650 – 22,700 → Immediate resistance on 1H chart
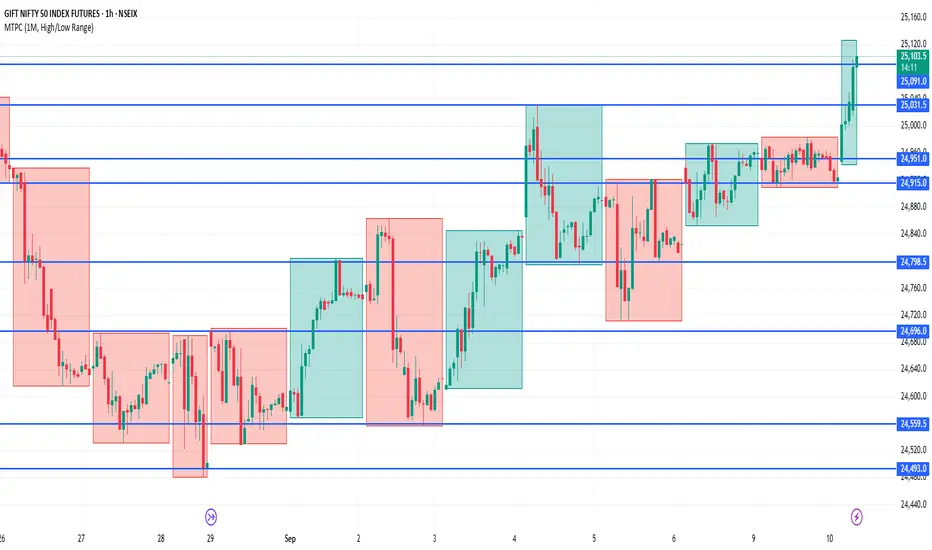
***''Boring Week or Trump-et?'''****- AVWAPs converging, candles are lackluster, trend remains unclear.
- Sideways movement likely between 24,700 and 25,050.
- Any breakout beyond the borders could be a trap—need a real “trumpet” for confirmation.

See all ideas
A representation of what an asset is worth today and what the market thinks it will be worth in the future.
Displays a symbol's price movements over previous years to identify recurring trends.
Frequently Asked Questions
The nearest expiration date for S&P CNX NIFTY INDEX FUTURES is Sep 30, 2021.
Traders prefer to sell futures contracts when they've already made money on the investment, but still have plenty of time left before the expiration date. Thus, many consider it a good option to sell S&P CNX NIFTY INDEX FUTURES before Sep 30, 2021.