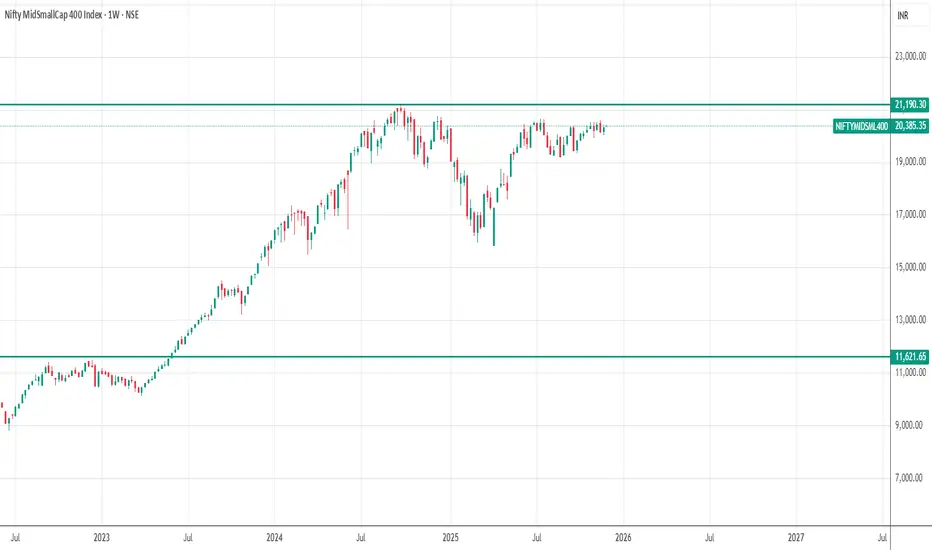
Midcap and small in the range before resistanceOn the chart midcap and small cap stocks seems to be struggling to break the resistance we should not start a new positional trade till the direction is clear. Your views?
Related indices
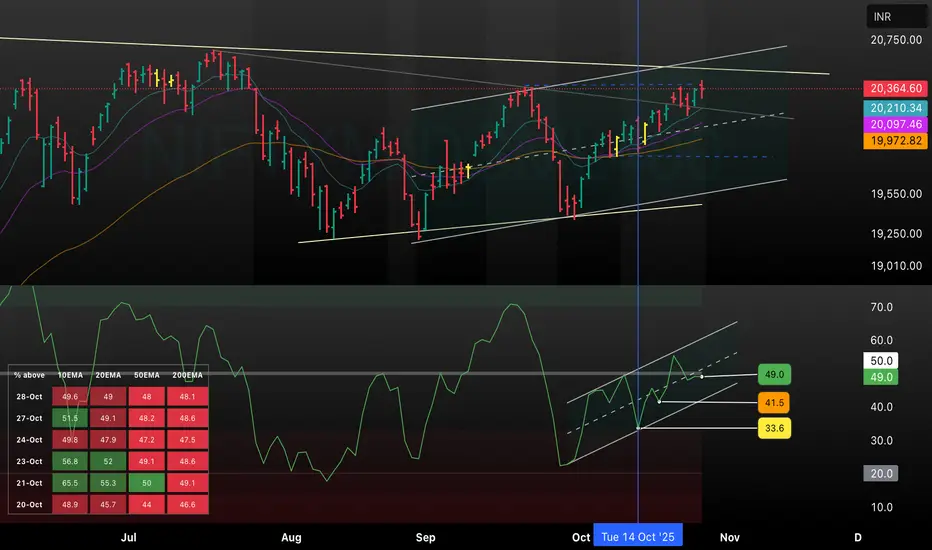
Nifty MidSmall 400 Market Breadth & Price Action Channel AnalysiThis TradingView chart provides a dual-pane analysis of the Nifty MidSmall 400 index, focusing on both price action and market breadth relative to key moving averages. The upper panel illustrates price movement within well-defined parallel channels, guided by dynamic support and resistance, and feat
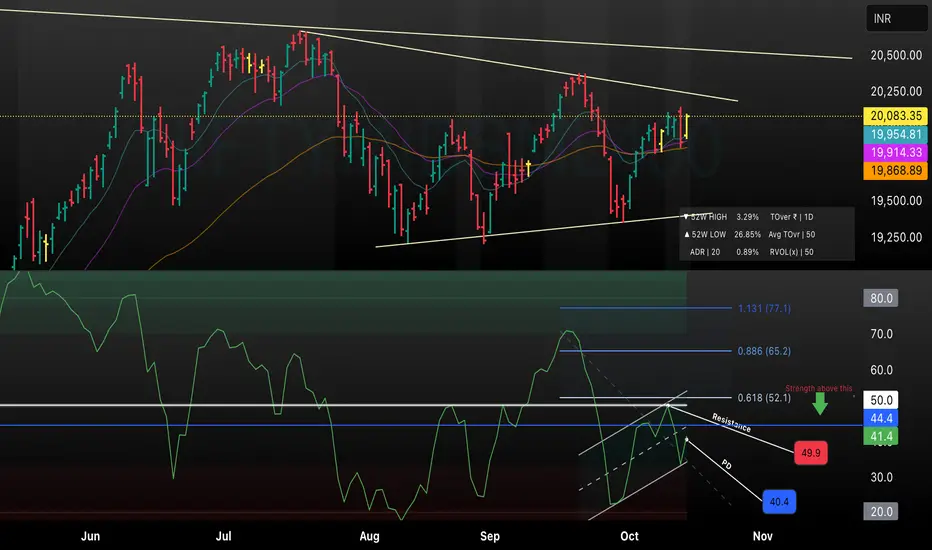
Nifty 50 Channel & Market Breadth Confluence AnalysisThis chart replaces the RSI indicator with a market breadth analysis, offering a broader view of participation across Nifty 50 components. The lower panel now plots a key market breadth indicator such as the Advance-Decline Line or the percentage of stocks trading above key moving averages, highligh
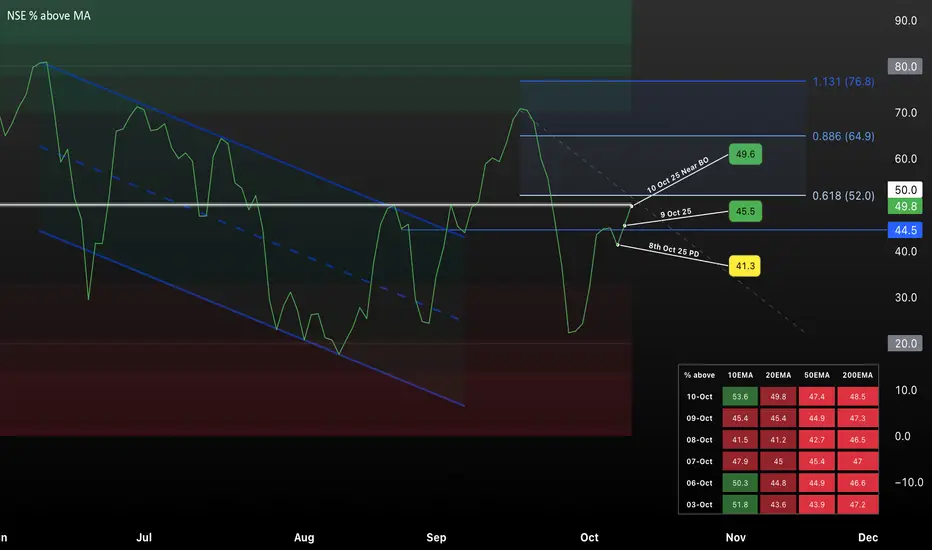
NSE % Above Moving Averages – October 2025 Breakout AnalysisThis TradingView chart visualizes the percentage of NSE stocks trading above key moving averages (10EMA, 20EMA, 50EMA, 200EMA) over recent months, highlighting a potential breakout zone as of October 2025. Key price levels (41.3, 44.5, 45.5, 49.6) are marked, with Fibonacci retracement zones indicat
bearish view on nifty next week📉 Nearest Support for Nifty MidSmallCap 400
Based on the chart and current price action, the nearest support zone for the Nifty MidSmallCap 400 Index appears to be:
🟩 Support Zone: ~19,000
- Labelled as “DLiq” (Demand Liquidity) on the chart
- Just below the current price of 19,437.20
- This zone li
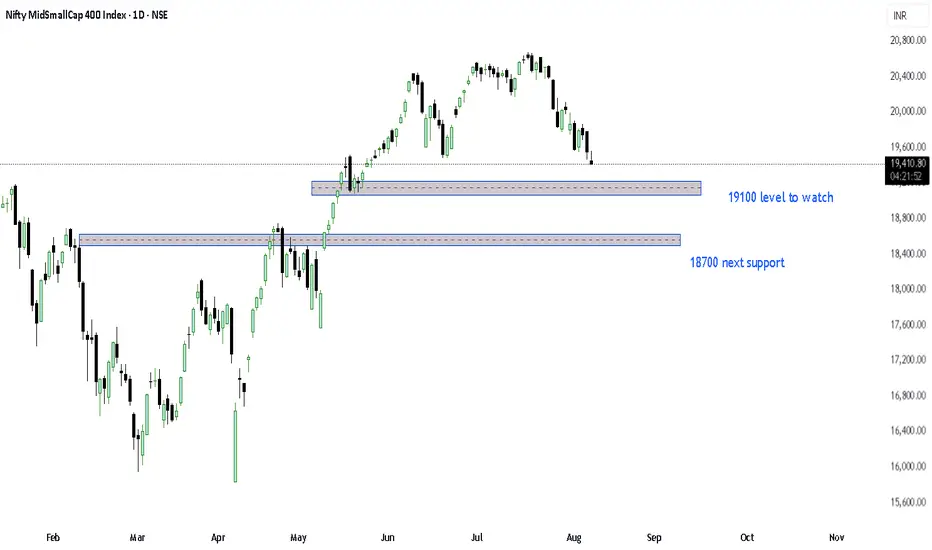
Nifty Mid small 400 index The index is breaking the tight range of the last 3 days on the lower side.
And there is a gap till 18755.
Lets see how we react around these levels.
Moving up after filling the gap is best for the coming days.

Nifty View 13.01.25The Nifty All Major Indices refer to key stock market indices that represent the performance of major segments of the Indian stock market. Here is a brief overview of some of the most notable Nifty indices:
### 1. **Nifty 50**
- **Description**: The Nifty 50 is the benchmark stock market index o

NIFTY MidSmallcap 400 - Negative breakoutThe index has already broken down below the 19,200 support range. The next strong support level appears to be around the 17,000 range, where a potential bounce-back could occur. However, there are three intermediate support levels in between. Let’s observe how mid-cap and small-cap stocks perform—wh

NIFTYMIDSML400NIFTYMIDSML400 has formed parallel and what we saw recently was just the trailer.
we still have big bull waiting for us. 12300-12000 may be good warning if this pattern could fail.
It may still take 3 year for index to reach upper edge of the parallel channel

really good policy small scale companies DEAR ALL POLICY MAKER AND MARKET MAKERS,INVESTORS,FUND MANGERS
I COMPARED NZX EXCHANGE SMALLCAP AND NIFTY MID AND SMALLCAP 400
SEE STILL OUR COMPANY NOT BOOM STRONG GIVEN TO SUPPORT ALL MSME INDUSTRY MORE FUNDING POLICY EASY MAKE TO ECNOMY RECOVER

See all ideas
Displays a symbol's price movements over previous years to identify recurring trends.