Midnifty Intraday Analysis for 26th July 2024NSE:NIFTY_MID_SELECT
Index closed near 12420 level and Maximum Call and Put Writing near CMP as below in current weekly contract:
Call Writing
12400 Strike – 16.77 Lakh
12500 Strike – 13.92 Lakh
12600 Strike – 7.58 Lakh
Put Writing
12400 Strike – 17.22 Lakh
12200 Strike – 13.61 Lakh
12300 Strike – 9.64 Lakh
Index has resistance near 12500 – 12600 range and if index crosses and sustain above 12600 level then may reach near 12700 – 12750 range.
Index has immediate support near 12300 level and if this support is broken then index may tank near 12100 – 12000 range.
NIFTY_MID_SELECT trade ideas

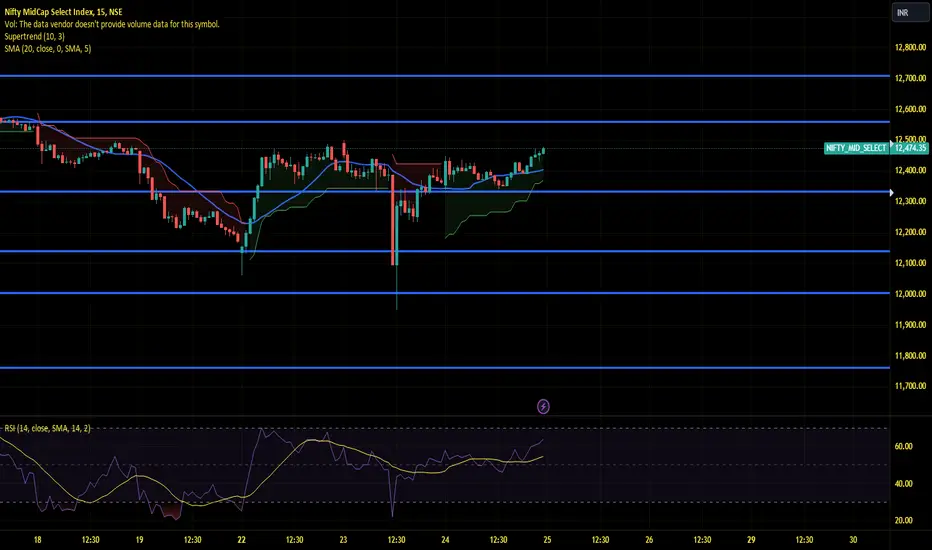
NIFTY MID SELECT FOR 29 Jul#Execution only after break and close above or below from resistance or support 15-minute candle.
#Stop Loss above or below from resistance or support 15-minute candle.
(S/R Levels Will be Flipped in The Situation of Gap up OR Gap down Open, Support Will Turn in Resistance and Resistance Will Turn in Support)
(This Analysis and idea is based only on support and resistance mechanism, Buy after resistance break and close above sell after support break and close below, Closing below resistance after trade will be stop loss likewise closing above support will be a stop loss after trade)
NOTE- Only for Education Purpose. This is not any kind of Trading advice I am giving by this analysis.
Please Give A Like If You Like

NIFTY MID SELECT FOR 26 Jul#Execution only after break and close above or below from resistance or support 15-minute candle.
#Stop Loss above or below from resistance or support 15-minute candle.
(S/R Levels Will be Flipped in The Situation of Gap up OR Gap down Open, Support Will Turn in Resistance and Resistance Will Turn in Support)
(This Analysis and idea is based only on support and resistance mechanism, Buy after resistance break and close above sell after support break and close below, Closing below resistance after trade will be stop loss likewise closing above support will be a stop loss after trade)
NOTE- Only for Education Purpose. This is not any kind of Trading advice I am giving by this analysis.
Please Give A Like If You Like

Midnifty Intraday Analysis for 25th July 2024NSE:NIFTY_MID_SELECT
Index closed near 12460 level and Maximum Call and Put Writing near CMP as below in current weekly contract:
Call Writing
12400 Strike – 13.35 Lakh
12500 Strike – 12.23 Lakh
12600 Strike – 6.81 Lakh
Put Writing
12400 Strike – 15.48 Lakh
12200 Strike – 10.32 Lakh
12300 Strike – 7.18 Lakh
Index has resistance near 12500 – 12600 range and if index crosses and sustain above 12600 level then may reach near 12700 – 12750 range.
Index has immediate support near 12300 level and if this support is broken then index may tank near 12100 – 12000 range.
NIFTY MID SELECT FOR 25 Jul#Execution only after break and close above or below from resistance or support 15-minute candle.
#Stop Loss above or below from resistance or support 15-minute candle.
(S/R Levels Will be Flipped in The Situation of Gap up OR Gap down Open, Support Will Turn in Resistance and Resistance Will Turn in Support)
(This Analysis and idea is based only on support and resistance mechanism, Buy after resistance break and close above sell after support break and close below, Closing below resistance after trade will be stop loss likewise closing above support will be a stop loss after trade)
NOTE- Only for Education Purpose. This is not any kind of Trading advice I am giving by this analysis.
Please Give A Like If You Like

Midcap Nifty trades and targets - 25/7/24Hello Everyone. The market was in a bearish/bullish mode today. If the market opens flat then we can see continuation of trend. If it opens gap up then we need to see the resistance level to break before looking for CE trades. If it opens gap down then look for PE trades after support zone is broken. Let the market settle in first 15 to 30 minutes then look for directional trades. Book profits every 30 points as we are getting very few trending moves.

Midnifty Intraday Analysis for 24th July 2024NSE:NIFTY_MID_SELECT
Index closed near 12375 level and Maximum Call and Put Writing near CMP as below in current weekly contract:
Call Writing
12400 Strike – 13.59 Lakh
12500 Strike – 8.81 Lakh
12600 Strike – 5.94 Lakh
Put Writing
12400 Strike – 9.81 Lakh
12000 Strike – 9.24 Lakh
12300 Strike – 7.82 Lakh
Index has resistance near 12500 – 12600 range and if index crosses and sustain above 12600 level then may reach near 12700 – 12750 range
Index has immediate support near 12200 level and if this support is broken then index may tank near 12100 – 12000 range.

NIFTY MID SELECT FOR 24 Jul#Execution only after break and close above or below from resistance or support 15-minute candle.
#Stop Loss above or below from resistance or support 15-minute candle.
(S/R Levels Will be Flipped in The Situation of Gap up OR Gap down Open, Support Will Turn in Resistance and Resistance Will Turn in Support)
(This Analysis and idea is based only on support and resistance mechanism, Buy after resistance break and close above sell after support break and close below, Closing below resistance after trade will be stop loss likewise closing above support will be a stop loss after trade)
NOTE- Only for Education Purpose. This is not any kind of Trading advice I am giving by this analysis.
Please Give A Like If You Like

Midcap Nifty trades and targets - 24/7/24Hello Everyone. The market was in a bearish/bullish mode today. If the market opens flat then we can see continuation of trend. If it opens gap up then we need to see the resistance level to break before looking for CE trades. If it opens gap down then look for PE trades after support zone is broken. Let the market settle in first 15 to 30 minutes then look for directional trades. Book profits every 30 points as we are getting very few trending moves.

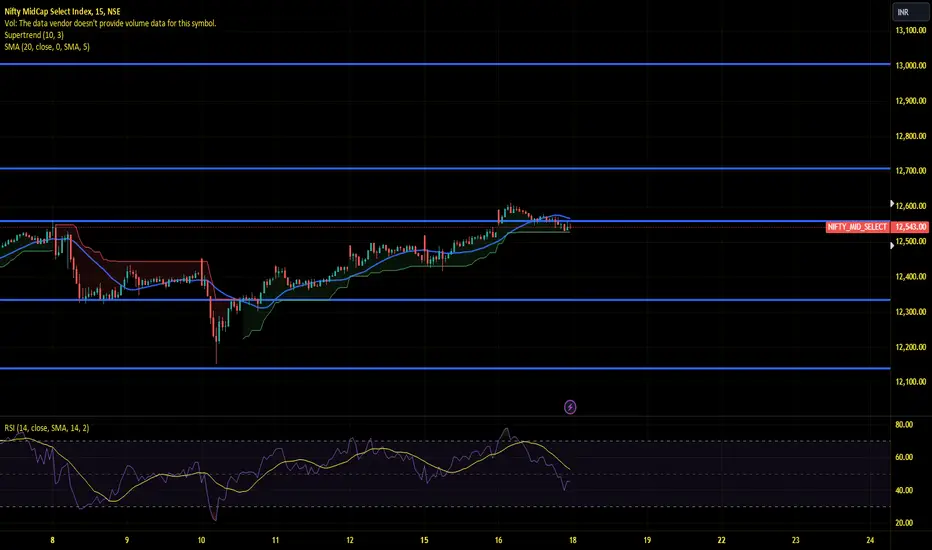
Midnifty Intraday Analysis for 23rd July 2024NSE:NIFTY_MID_SELECT
Index closed near 12415 level and Maximum Call and Put Writing near CMP as below in current weekly contract:
Call Writing
12400 Strike – 4.80 Lakh
12500 Strike – 2.83 Lakh
12600 Strike – 1.84 Lakh
Put Writing
12400 Strike – 4.58 Lakh
12300 Strike – 2.66 Lakh
11900 Strike – 2.35 Lakh
Index has resistance near 12500 – 12600 range and if index crosses and sustain above 12600 level then may reach near 12700 – 12750 range
Index has immediate support near 12300 level and if this support is broken then index may tank near 12100 – 12000 range.
Budget Day experience high volatility.

NIFTY MID SELECT FOR 23 Jul
#Execution only after break and close above or below from resistance or support 15-minute candle.
#Stop Loss above or below from resistance or support 15-minute candle.
(S/R Levels Will be Flipped in The Situation of Gap up OR Gap down Open, Support Will Turn in Resistance and Resistance Will Turn in Support)
(This Analysis and idea is based only on support and resistance mechanism, Buy after resistance break and close above sell after support break and close below, Closing below resistance after trade will be stop loss likewise closing above support will be a stop loss after trade)
NOTE- Only for Education Purpose. This is not any kind of Trading advice I am giving by this analysis.
Please Give A Like If You Like

Midcap Nifty trades and targets - 23/7/24Hello Everyone. The market was in a bullish mode today. If the market opens flat then we can see continuation of trend. If it opens gap up then we need to see the resistance level to break before looking for CE trades. If it opens gap down then look for PE trades after support zone is broken. Let the market settle in first 15 to 30 minutes then look for directional trades. Book profits every 30 points as we are getting very few trending moves.

Mid Cap Nifty Expressway: should we getoff?Midcap Nifty has been a one way streak since it's Inception for trading. The index is following higher highs and highest lows pattern for a very long period. The drawings on the chart shows a channel which may be helpful for retracement after the announcement of Union Budget 2024. However, immediate reversal are not more likely but gradually we may see profit booking in the midcap stocks, which may further result in reversal in the index.

Midnifty Intraday Analysis for 22nd July 2024NSE:NIFTY_MID_SELECT
Index closed near 12195 level and Maximum Call and Put Writing near CMP as below in current weekly contract:
Call Writing
12500 Strike – 44.02 Lakh
12600 Strike – 35.65 Lakh
12400 Strike – 35.53 Lakh
Put Writing
12000 Strike – 29.40 Lakh
12200 Strike – 14.87 Lakh
11900 Strike – 13.89 Lakh
Index has resistance near 12300 – 12350 range and if index crosses and sustain above 12350 level then may reach near 12500 – 12600 range.
Index has immediate support near 12000 level and if this support is broken then index may tank near 11900 level.
However, due to Budget on 23rd July 2024, Index less likely to go up.

Moving Average, MACD, RSI: Which is No. 1 Indicator?Moving Average, MACD, RSI: Which is No. 1 Indicator?
When trading in the stock market, choosing the right technical indicators can make all the difference.
Among the most popular are the Moving Average (MA), Moving Average Convergence Divergence (MACD), and Relative Strength Index (RSI).
Every one of them gives various insights: MA helps to identify trends, MACD is useful for identifying shifts in momentum, and RSI indicates overbought or oversold conditions.
However, which one is better? This article compares these three indicators, outlining their strengths and possible usage scenarios, so that you can pick out which tool complements your trading method.
What is the Moving Average?
A moving average is a tool used by market analysts and traders to understand the trend direction of a financial asset.
It works by averaging the asset's prices over a specific time period. This average is "moving" because it updates with each new price data point, incorporating only the most recent prices.
Stock analysts use the moving average to analyze support and resistance levels by observing the price movements of an asset relative to the average.
This reflects past price action and helps predict potential future price directions.
As a lagging indicator, the moving average follows the asset's price trends and provides signals or directional indications based on historical data.
What is MACD?
The Moving Average Convergence Divergence (MACD) is a widely used momentum indicator in technical analysis, created by Gerald Appel in the late 1970s.
It helps traders gauge momentum and trend strength by comparing two different time periods of historical price data.
MACD calculates a momentum oscillator by subtracting a longer-term moving average from a shorter-term one, known as "divergence." Typically, exponential moving averages (EMA) are chosen for their responsiveness in reflecting recent price changes.
This indicator is valuable for identifying shifts in market momentum and guiding trading decisions based on historical price movements.
What is RSI?
The Relative Strength Index (RSI), created by J. Welles Wilder, is a tool used to gauge the speed and magnitude of price changes in the market.
Typically calculated over a 14-day period, the RSI ranges from zero to 100. It offers immediate insights into buying and selling signals, helping determine if an asset is either overbought or oversold.
RSI values below 30 indicate potential buy opportunities, suggesting the asset may be undervalued.
Conversely, RSI readings above 70 suggest sell opportunities, indicating potential overvaluation. A reading of 50 indicates a balance between bullish and bearish sentiment or a neutral market stance.
Which Indicator is The Best?
The choice of indicator in technical analysis depends on a trader’s strategy, goals, and market conditions.
Each of the mentioned indicators - Moving Average (MA), Moving Average Convergence Divergence (MACD), and Relative Strength Index (RSI) - has its own strengths and applications.
For example, the Moving Average (MA) is a trend-following or lagging indicator because it is based on past prices.
It helps to smooth out price data by creating a constantly updated average price, which can be taken over different periods of time, like 20 days, 50 days, or 200 days.
It’s primarily used to identify trend direction, but can also be used to generate potential buy and sell signals.
Alternatively, the MACD is a momentum indicator that follows trends by comparing two moving averages of a security's price.
It generates technical signals to buy when it crosses above its signal line and to sell when it crosses below. This indicator is useful for identifying the beginning of new bullish or bearish trends.
Finally, RSI is a momentum oscillator that measures the speed and change of price movements. It is used to identify overbought or oversold conditions in a market, which can indicate potential reversals.
So basically, there’s no definitive “Best”. The best indicator often depends on your trading strategy and goals. Some traders might find MA most useful, while others might prefer MACD or RSI.
It’s often recommended to use a combination of indicators for the best results.
Conclusion
While each indicator—Moving Average, MACD, and RSI—has its strengths, there isn't a one-size-fits-all answer to which is best.
Successful trading often involves using a combination of indicators tailored to market conditions and individual trading styles.
Whether you prefer trend following, momentum trading, or timing market reversals, understanding how to effectively utilize these tools will enhance your ability to make informed trading decisions.

BEARISH VIEW ON MIDNIFTY DOUBLE TOP bana hai yaha se humesha doh chejay hoti hai ya toh necchay ki taraf footega or top k darshan kuch saal baadh ho saktey and m pattern fail hua toh dusri taraf rally achi aayegi

NIFTY MID SELECT FOR 22 Jul
#Execution only after break and close above or below from resistance or support 15-minute candle.
#Stop Loss above or below from resistance or support 15-minute candle.
(S/R Levels Will be Flipped in The Situation of Gap up OR Gap down Open, Support Will Turn in Resistance and Resistance Will Turn in Support)
(This Analysis and idea is based only on support and resistance mechanism, Buy after resistance break and close above sell after support break and close below, Closing below resistance after trade will be stop loss likewise closing above support will be a stop loss after trade)
NOTE- Only for Education Purpose. This is not any kind of Trading advice I am giving by this analysis.
Please Give A Like If You Like

Midcap Nifty expiry trades and targets - 22/7/24Hello Everyone. The market was in a bearish mode today. If the market opens flat then we can see continuation of trend. If it opens gap up then we need to see the resistance level to break before looking for CE trades. If it opens gap down then look for PE trades after support zone is broken. Let the market settle in first 15 to 30 minutes then look for directional trades. Book profits every 30 points as we are getting very few trending moves.

Midnifty Intraday Analysis for 19th July 2024NSE:NIFTY_MID_SELECT
Index closed near 12475 level and Maximum Call and Put Writing near CMP as below in current weekly contract:
Call Writing
13000 Strike – 22.05 Lakh
12500 Strike – 18.82Lakh
12600 Strike – 13.13 Lakh
Put Writing
12100 Strike – 9.88 Lakh
12400 Strike – 9.44 Lakh
12500 Strike – 9.38 Lakh
Index has resistance near 12600 level and if index crosses and sustain above 12625 level then may reach near 12700 – 12750 range.
Index has immediate support near 12400 - 12350 range and if this support is broken then index may tank near 12200 level.
Midcap Nifty trades and targets - 19/7/24Hello Everyone. The market was in a bearish mode today. If the market opens flat then we can see continuation of trend. If it opens gap up then we need to see the resistance level to break before looking for CE trades. If it opens gap down then look for PE trades after support zone is broken. Let the market settle in first 15 to 30 minutes then look for directional trades. Book profits every 30 points as we are getting very few trending moves

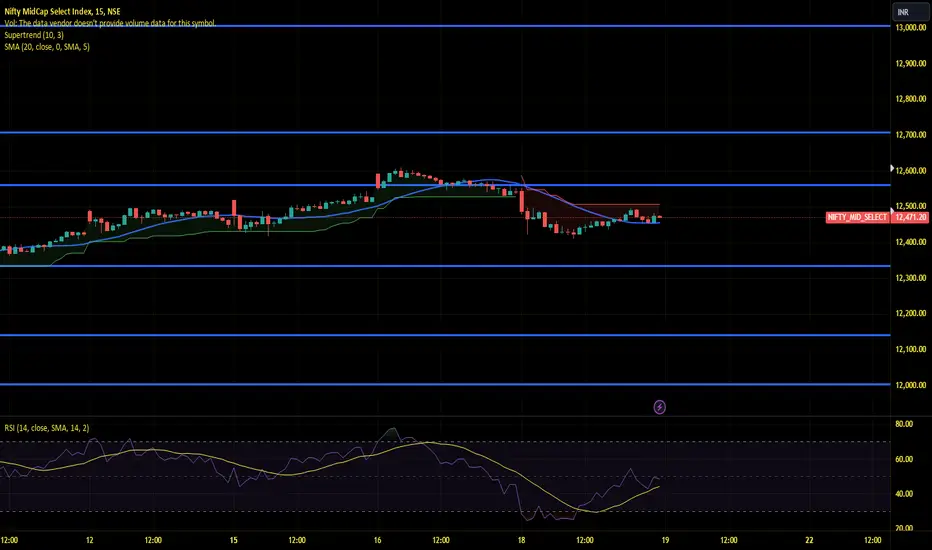
Midnifty Intraday Analysis for 18th July 2024NSE:NIFTY_MID_SELECT
Index closed near 12545 level and Maximum Call and Put Writing near CMP as below in current weekly contract:
Call Writing
12600 Strike – 10.52 Lakh
13000 Strike – 10.07 Lakh
12500 Strike – 6.55 Lakh
Put Writing
12500 Strike – 7.34 Lakh
12600 Strike – 4.60 Lakh
12300 Strike – 4.55 Lakh
Index has resistance near 12600 level and if index crosses and sustain above 12625 level then may reach near 12700 – 12750 range.
Index has immediate support near 12400 - 12350 range and if this support is broken then index may tank near 12200 level.
live market trade midcap break this level then will see breakdown. midcap nifty has strong support zone at 12430 level

Midcap Nifty trades and targets - 18/7/24Hello Everyone. The market was in a bearish mode today. If the market opens flat then we can see continuation of trend. If it opens gap up then we need to see the resistance level to break before looking for CE trades. If it opens gap down then look for PE trades after support zone is broken. Let the market settle in first 15 to 30 minutes then look for directional trades. Book profits every 30 points as we are getting very few trending moves.
