NIFTY MID SELECT FOR 16 FEB#Execution only after break and close above or below from resistance or support 15-minute candle.
#Stop Loss above or below from resistance or support 15-minute candle.
(S/R Levels Will be Flipped in The Situation of Gap up OR Gap down Open, Support Will Turn in Resistance and Resistance Will Turn in Support)
(This Analysis and idea is based only on support and resistance mechanism, Buy after resistance break and close above sell after support break and close below, Closing below resistance after trade will be stop loss likewise closing above support will be a stop loss after trade)
NOTE- Only for Education Purpose. This is not any kind of Trading advice I am giving by this analysis.
Please Give A Like If You Like
NIFTY_MID_SELECT trade ideas

NIFTY MID SELECT FOR 15 FEB#Execution only after break and close above or below from resistance or support 15-minute candle.
#Stop Loss above or below from resistance or support 15-minute candle.
(S/R Levels Will be Flipped in The Situation of Gap up OR Gap down Open, Support Will Turn in Resistance and Resistance Will Turn in Support)
(This Analysis and idea is based only on support and resistance mechanism, Buy after resistance break and close above sell after support break and close below, Closing below resistance after trade will be stop loss likewise closing above support will be a stop loss after trade)
NOTE- Only for Education Purpose. This is not any kind of Trading advice I am giving by this analysis.
Please Give A Like If You Like

NIFTY MID SELECT FOR 14 FEB#Execution only after break and close above or below from resistance or support 15-minute candle.
#Stop Loss above or below from resistance or support 15-minute candle.
(S/R Levels Will be Flipped in The Situation of Gap up OR Gap down Open, Support Will Turn in Resistance and Resistance Will Turn in Support)
(This Analysis and idea is based only on support and resistance mechanism, Buy after resistance break and close above sell after support break and close below, Closing below resistance after trade will be stop loss likewise closing above support will be a stop loss after trade)
NOTE- Only for Education Purpose. This is not any kind of Trading advice I am giving by this analysis.
Please Give A Like If You Like

NIFTY MID SELECT FOR 13 FEB#Execution only after break and close above or below from resistance or support 15-minute candle.
#Stop Loss above or below from resistance or support 15-minute candle.
(S/R Levels Will be Flipped in The Situation of Gap up OR Gap down Open, Support Will Turn in Resistance and Resistance Will Turn in Support)
(This Analysis and idea is based only on support and resistance mechanism, Buy after resistance break and close above sell after support break and close below, Closing below resistance after trade will be stop loss likewise closing above support will be a stop loss after trade)
NOTE- Only for Education Purpose. This is not any kind of Trading advice I am giving by this analysis.
Please Give A Like If You Like

NIFTY MID SELECT FOR 12 FEB #Execution only after break and close above or below from resistance or support 15-minute candle.
#Stop Loss above or below from resistance or support 15-minute candle.
(S/R Levels Will be Flipped in The Situation of Gap up OR Gap down Open, Support Will Turn in Resistance and Resistance Will Turn in Support)
(This Analysis and idea is based only on support and resistance mechanism, Buy after resistance break and close above sell after support break and close below, Closing below resistance after trade will be stop loss likewise closing above support will be a stop loss after trade)
NOTE- Only for Education Purpose. This is not any kind of Trading advice I am giving by this analysis.
Please Give A Like If You Like

NIFTYMIDCPSELECT WEEKLY EXPIRY HOURLY GANN SQR CHART 12 FEB 2024Chart attached above showing the Index Squaring Levels wit important Hourly Time Periods to watch. Earlier support at cluster above 50% has become resistance cluster. Need a gap up above to further momentum. Staying above the 50% level is must.
Happy Trading !!!

Midcapnifty Tomorrow will be new all time high or big down side possible..just view ..coz view view hota hai ...Paisa Paisa ...so only go with trend...not with flood...ask your Fin advisor for more help

Midcapnifty Indian mkt fundaRetail trder only make money intraday..hahaha...coz experienced traders carry out at top ... And said I did it Max time...that's bullshit ...work for only 25pt in midcapnifty makes you good then better ..traders...but when working 25pt support resistance .. maximum time you blast your account on intraday...by saying yaar...ye reversal Aya dikha buy ce buy pe...so please follow the footprint you will reach your tgt ..and above is ma view not for trade

NIFTY MID SELECT HOURLY GANN LEVELS FOR 05 FEB 2024 EXPIRYWe have consider the swing bottom to rise therafter as our range for analysis. We see an 12.5% extension resistance on the chart. The level of 10793.50 is important and needs to be crossed for further gains on the index. Below level of 10724.95 is important for trend setting on expiry day. Use this level as your trading bias for expiry.
Happy Trading !!!

Midcapnifty Views are mentioned don't make entry just watch ..levels are mentioned ..but mkt is at all time have with small gaps remaining...big movie only captured with patience...walk like lion ..hunt like lion

Triple top in Mid Cap Select Nifty. Can be shorted nowTriple top in Mid Cap Select Nifty. Can be shorted now
Entry - 8620
SL - 8700
Target - 8450
Entered a credit spread in options
Sold Aug 28th 8600 CE at 96
Bought Aug 28th 9000 CE at 18.95

MidcapniftySupport and resistance mentioned in above it my view ..for tomorrow will fryday or black Friday...retracement will be upto 10100 possible...if life time breched then upside till Feb end...it personal view not recommended to buy or sell

NIFTY MIDCAP Expiry (29Jan24) - LONGAs long as Nifty midcap stays above 10375-80 range post 10am IST, then target 10456 / 10487 / 10516 for expiry.

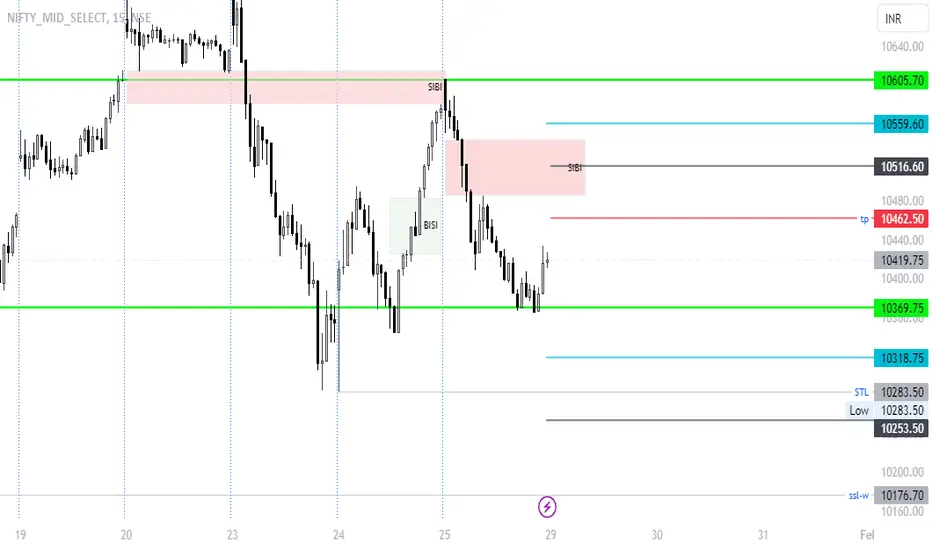
MIDCPNIFTY expiry view on 29-01-2024Price has created sell side imbalance area which price is likely to respect. This imbalance area may further print downward to test the sell side liquidity near 10283.Market range: 10605-15560-10462-10369-10319-10283-1025.
NIFTY MIDCAP SELECT WEEKLY EXPIRY HOURLY GANN LEVELS CHART 29JANMidcap Select Index has closed at 10415.95. It is sideways between 10346.30 and 10465.10. We are waiting for Budget clues and after a fantastic run markets are cooling down. We were resisted at the cluster levels of 10562.55 and 10583.95. We have retraced down nearly 150 points from there. Important trend deciding level for expiry is 10405.70. Above which trend is up and below it trend is down. Use the sideways 100 points range for trading by dividing it into 4 parts of 25 points each. So use the levels of 10346.30/10371.35/10396.45/10421.50/10465.10 for expiry trading. Any extension on upside or downside should be traded cautiously for fakeouts if any.
Happy Trading !!!
N.B. Not a Trading Advice. With all usual disclaimers as applicable within the reach of this beautiful trading and analysis platform.

NIFTY MIDCAP WEEKLY EXPIRY HOURLY GANN LEVELS UPDATED 20/01/2024We are completing a volatile week in the Indian markets after a big bull run in all broader indices. Markets movements can be very volatile whenever new all time highs are done. Corrections follow after signiicant tops are formed. I had a target near 11050-11100 on this index. All time high is 10669.50.
Levels to watch on chart for today is 10562.55 and 10524.55 the cluster. Resistance at 10643.30 and support at 1045.10
Happy Trading !!!
N.B. With all usual disclaimers as applicable on this beautiful platform. Not a trading advice.

NIFTY MICAP SELECT WEEKLY EXPIRY 15/01/2024We have a weekly expiry coming up on the index on Monday 15/01/2024. Index has closed at 10542.40. Friday highest traded options on the index were 10600CE and 10500PE which have closed at 12.65 and 15.15. Chart shows 10560.75 as the important level above which we can attempt the previous swing of 10605.45. So futures buying and Call options buying we need to stay above the 10560.75 levels. As this is the price death zone level one need to be cautious.
On the downside 10516.05 is important which squaring the range.
Index will be sideways between 10560.75 to 10650.15. Momentum can be seen above 10650.15 on the upside and below 10516.05 on the downside.
Happy Trading !!!

NIFTY MIDCAP SELECT WEEKLY EXPIRY GANN LEVELS CHART 08/01/2024Today index has opened at 10581.60 on chart. Moved down two steps and moved up one step on chart. Resistance was 10581.60 and support was 10505.65.
Two possible trades one short and one buy could have been done as per levels marked.
Playing this intraday range will be beneficial for intraday traders as per their risk profile.
One can also add trades on either sides if your a breakout trader as per levels given on chart.
Happy Trading !!!

Mid-Cap Nifty 04 January 2024Kindly take note of the analysis for Mid-Cap Nifty on January 4th, 2024. The Blue Bold line represents the resistance level, while the Red Bold line indicates the support level. The Yellow dotted lines mark the targets on both sides, and the trend line(s) should be carefully considered. It's crucial to develop a trading strategy based on this information. Please note that this is my personal view, and there may be a possibility of error.

Mid-Cap Nifty 03 January 2024Kindly take note of the analysis for Mid-Cap Nifty on January 3rd, 2024. The Blue Bold line represents the resistance level, while the Red Bold line indicates the support level. The Yellow dotted lines mark the targets on both sides, and the trend line(s) should be carefully considered. It's crucial to develop a trading strategy based on this information. Please note that this is my personal view, and there may be a possibility of error.

Mid-Cap Nifty 02 January 2024Kindly take note of the analysis for Mid-Cap Nifty on January 2nd, 2024. The Blue Bold line represents the resistance level, while the Red Bold line indicates the support level. The Yellow dotted lines mark the targets on both sides, and the trend line(s) should be carefully considered. It's crucial to develop a trading strategy based on this information. Please note that this is my personal view, and there may be a possibility of error.

NIFTY MIDCAP SELECT HOURLY CHART WITH GANN LEVELS....Nifty Midcap Select Index with 4 important zone levels marked on chart above. The cluster levels at middle are 10105 and 10080.50 . The upperzone level is 10243.10 and the lower zone is 9951.10 . Shorterm traders can use these levels for trading purpose as per their risk profile.
Happy Trading !!!

Mid-Cap Nifty 01 January 2024 (Expiry)Kindly take note of the analysis for Mid-Cap Nifty on January 1st, 2024. The Blue Bold line represents the resistance level, while the Red Bold line indicates the support level. The Yellow dotted lines mark the targets on both sides, and the trend line(s) should be carefully considered. It's crucial to develop a trading strategy based on this information. Please note that this is my personal view, and there may be a possibility of error.
