NTPC PATTERN AND CHART ANALYSISlooking a great short opportunity in NTPC
REASONS-
1 DECREASE IN MOMENTUM
2 PRICE HAD ALREADY TAKEN RESISTANCE & NOW GOING DOWN
3 CONFUSED GREEN CANDLE i.e. LOW BULLISH POWER
P.S. - its just an idea 'DO YOUR OWN ANALYSIS'
NSE:NTPC
NTPC trade ideas

ntpc - 3 time touching trendlinestock at high range , stock touching trendline 3 times at high , but volume is not upto the mark, but RSI is supporting
NTPC LTD: Strong BuyNSE:NTPC shows strong buy indicated by RSI, IMI, MACD & Fisher crossover followed by EMA & MA Crossover
Target 2: 175.60
Target 1: 154.90
Stop Loss: 140.50
Disclaimer:
The analysis is only for illustration purposes only. Please consult your financial advisor, agent, broker before acting on any information. We may or may not have positions in the stock and our actions may be contrary to the one mentioned here. This analysis may or may not be updated. We would not be responsible for the profit/loss resulting from this analysis.

SHORT ON NTPCNTPC is facing strong resistance at current levels. NTPC can retrace back to 140 levels in the near term.

NTPCNTPC getting along a very long trend line support. If it breaks down, a good down move is possible. One can look for shorting opportunities in this counter. Note : For educational purpose only.

NTPCThis guy taking support from trendline.
Gave more than 20% everytime.
Similar set in POWERGRID.
Hope this is our side.

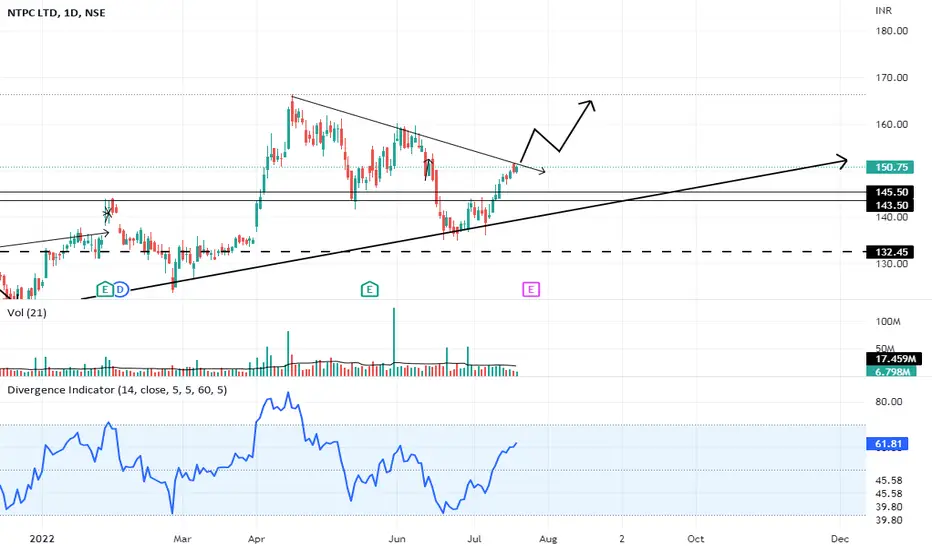
NTPC - 7th July 2022Stock in Trading Range between 142-135.
Break of Range could let to a sustained move in that direction

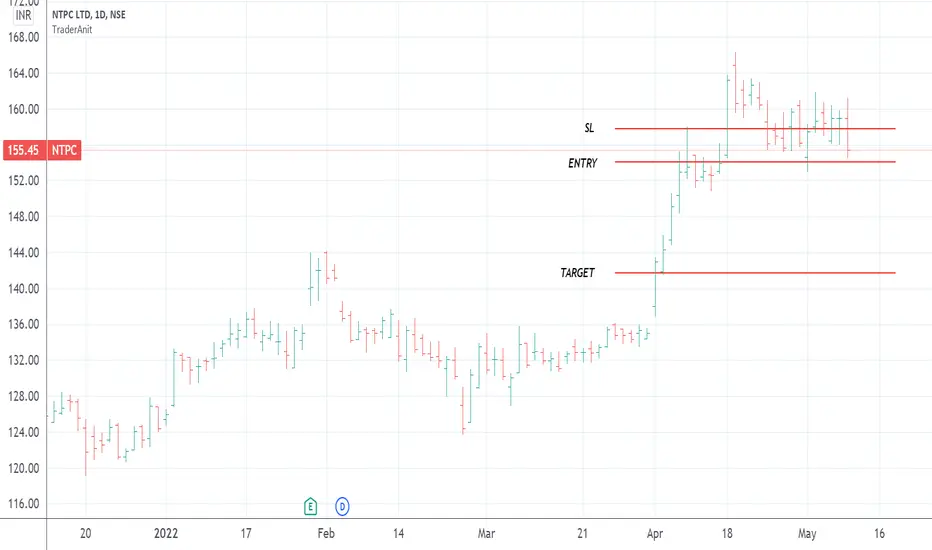
GO LONG ON NTPCNSE:NTPC
It is short term trade.
The stock is at 200 moving average support .
The stock is at support zone,
Target of 143 can be seen , and final target of 153 .
This is for educational purpose.

NTPC SUPPORT AREANTPC taken support. BE cautious with trade because market is heavy volatile day by day.

NTPC DOUBLE GAMEIf Breaks Then The Targets could be Taken at 124.30 .
Time Frame :- 1 Hour
Patterns Name :- Double Top
Symbol Name :- Ntpc
Comment Below If You want to ask me questions on this on any other idea .
Based on Your Own Risk this is only to Show you the Current Pattern .
We are not responsible for any profit or loss .
BTW Like and Follow if you like this awesome content
Made By MAYANKTECHRESEARCHING

NTPC stock testing trendline NTPC LTD stock testing trendline can go LONG (BUY) or SHORT (SELL) based on reversal or breakdown

NTPC LTD 15min Descending Triangle In 15min TF, we can see that there is a descending triangle pattern. It can breakout either side in Intraday.
We can go LONG if it breaks the Resistance @ Rs150-155/-
If the price breaks the trendline of the triangle, we can go SHORT. The nearby support is at Rs. 145-147/-

harmonic in ntpc case studyjust for educational purposes
case study
not every W shape or M shape is an harmonic
harmonic follows strict rules
like B point should be 0.786 retracement of XA leg
And C point should be 0.886 or 0.382 or in between if near values good and is retracement of AB leg
and D 1.618 or 2.24 of BC and 1.27 of XA
these are for butter fly for other patterns retracements will vary
i started studying harmonics recently will take some time to master meanwhile looking for some examples if any please suggest me ,which are near exact retracements according to patterns
disclaimer- this is not any investment call or idea , this just my view and it can go wrong ,this is only for educational purposes trade at your own risk :)


NTPC in Rising flag pattern on 2h TF.My Friends, As we can see that what is happening in NTPC. After a big fall NTPC is Continuously Trading in Rising flag pattern.we know that this type of patterns indicates towards bearish Momentum. Our view is totally brearish side on this. We can short this when price Cross below 153 & show bearish rejection with the accurate target 🎯of 150, 148.We can also add this in our watchlist. Intraday players ready for big momentum in upcoming days. NTPC is calling you.

NTPC - 9th June 2022Stock facing Medium Term Resistance at 165-155 Levels.
Bears can try to dominate by pushing prices lower

YR 2022 Idea #60: Long on NTPC This is a public swing trade idea and is only for Learning and observational purpose. Please understand your risk and take full responsibility of your actions. I might trail my stoploss after I get an entry but even if my original Stoploss hits, i exit the trade with pre-planned loss (risk). At target, I book usually 75% positions and trail stoploss for rest. Our objective to help anyone who wants to learn technical analysis using charts by demonstrating my real trade entries. You can post your queries in comment section here and we will try to answer them asap.

Retest on DowntrendAfter breakout, NTPC came back to downtrend line and retested it.
From this level, it is showing a bullish move.
So, initiate your trade for a short term with strict stop loss.
(Disclaimer: For educational purposes only)


Intraday Levels | NTPC | 30-05-2022 [INTRADAY]NSE:NTPC
Observations:
1) On 1day Time frame, we can see it is between resistance and support trendline and making triangle pattern.
Please refer below chart : 1day time frame.
Same chart on 15min TF.
Please refer below chart : 15min time frame.
-------------------------------------
Trade Setup for 30-05-2022
1) Don't Jump in to trade at the beginning of the market. Let it get settle for 15-20min first and judge the price action.
2) Everything is mentioned on the chart. I hope it is easy to understand.
3) All the levels will work as support, resistance, entry and exit w.r.t price action near that level.
4) Avoid gap up or gap down chase. Wait and trade between levels.
Please refer below chart for levels.
Hope I made it easy to understand it.
Do comment your doubt or suggestion.
Note: Trade with Strict SL. It may or may not hit all the levels. So one can book profit / loss at respective level considering how price action works near that level.

NTPC @ Major SupportNSE:NTPC
#NTPC trading @ major support level and high chances to bounce.
Complete analysis marked on chart !!
Happy LEarning !!

NTPC 2% 🎯🔥🔥🔥 tillnowNSE:NTPC
#NTPC shared yesterday and it bagged 2% till now
#NTPC 140CE 22k/lot bagged 🔥🔥🔥🔥
Wish everyone bagged good money with learning experience 👏👏👏👏
Check out the other stocks with levels shared and delivered good results.
Happy LEarning !!
