A BREAKOUT & RETESTED STOCK - NTPC NSE:NTPC
❇️A good low risk setup in daily time frame above 432 makes a perfect entry.
❇️SL below recent swing low. 420
❇️A very good weekly break out at weekly time frame.
❇️Expecting stock price to reach 445-450-460+ in up coming days.
❇️ Volume looks good.
❇️Every entry must have a stoploss partnered with it.
Disclaimer: not SEBI Registere and not responsible for your profits and your losses thank you 🌻
👉🏻 @thetradeforecast 🇮🇳
NTPC trade ideas

NTPC breaks out post one month consolidationNTPC moving with imulsive 5 wave up of which wave 3 done near 226 and post that stock went into the consolidation zone for one month for wave 4.
now moving up for wave 5.
all-time high of stock is near 242

NTPC Continuing Bullish TrendNSE:NTPC Continuing Bullish Uptrend, After making Election Results High those levels acted as Resistance, and now that Resistance is acting like a support on a daily timeframe, today was a Vol. Spurt because of Value Unlocking of NTPC Green Energy IPO News. Keep a Close Watch Ahead.
Disclaimer: This analysis is intended solely for informational and educational purposes and should not be interpreted as financial advice. It is advisable to consult a qualified financial advisor or conduct thorough research before making any investment decisions.

Some information about NTPCNTPC is a government-owned corporation in India that generates power from various sources, including coal, gas, and renewable energy sources. The corporation operates several power plants across the country, with a total installed capacity of over 60,000 MW.
Here are some key levels related to NTPC:
Installed Capacity: Over 60,000 MW (as of 2022)
Power Generation: Around 250-300 billion units (BU) per year
Fuel Mix: Coal (60%), Gas (20%), Renewable Energy Sources (20%)
Employee Strength: Over 17,000 employees
Revenue: Over ₹1 lakh crore (approximately $13.8 billion USD) in FY2020-21
Net Profit: Over ₹14,000 crore (approximately $1.9 billion USD) in FY2020-21
Share Price: Listed on the Bombay Stock Exchange (BSE) and National Stock Exchange (NSE) of India, with a current market capitalization of over ₹2 lakh crore (approximately $27.6 billion USD)

BUY NTPCNTPC is in strong uptrend and after good correction it is bouncing back from its support near 405. Buy around 407 with SL 402 for TGT 412-417

NTPC FOR 430+NTPC is one of the leading company of Thermal power sector now on top of break out.
I see strength in his chart I am bullish on this script as i do see double bottom pattern also
C.M.P 📑- 414
Target 🎯 - 393
Stoploss 🚫 - 430+
Important: Always maintain your Risk & Reward Ratio.
✅Like and follow to never miss a new idea! ✅
Disclaimer: This is not any stock recommendation; this is only for educational purpose.
Eat🍜 Sleep😴 Trading View📈 Repeat 🔁

NPTC looks buy based on Hourly Charts 15% upside possibility.NPTC looks buy based on Hourly Charts 15% upside possibility.
Post consolidation upside trend to resume.
LTP - 407
Targets - 465-470
SL - 392
Timeframe - 2-3 Months.
Happy Investing.

NTPC forming a channelNTPC forming a parallel channel. Could provide a breakout if it manages to break from the current channel with enough volume. keep in watchlist, wait for the channel breakout.


NTPC Breakout -BUYNTPC is making all time high. Lets see why its a good buy at current level.
1. Structure -
a. Resistance - Three selling rejections from 390 area since 04 june 2024. Before that 380 acted as resistance. Broke out above 400 on 29th July but showed selling. Important thing is it showed buying again next day and is now above 400 again.
So it broke above 400, gave pull back and bought again above 400. Our earlier Resistance 400 is now acting as support.
b. Support - 390, 361.
2. Trend - Up trend in daily as well as weekly time frame.
3. Overall market - Nifty is strong and is in Up trend.
4. Conclusion - NTPC has given breakout above 390 zone, selling from above this level failed to push it lower this time. Current level is good level to buy.
Entry -current price.
Target - 450, 495.
If you find this information useful please do like, share and follow, thanks.

NTPC F&PBREAKOUT WCBNTPC breaking f&p pattern
weekly basis with good volume
strong rsi,macd crossover
target1 455 target2 525
my sl 365
EDUCATINAL IDEA

BREAKOUT in NTPC (Power Stock)NTPC is ready to BREAKOUT.
The stock was in consolidation phase from march.
Volatility has contracted over period with positive upwards moment.
Stock closed above the 20 MA after yesterday's budget shakeout.
Ready to BURST.


#NTPC: Trading Near All Time High with Potential BreakoutNTPC is showing strong signs of a potential breakout as it trades near its all-time high. The stock is awaiting a trendline breakout, with growing volume adding confirmation.
Key Metrics:
P/E Ratio: 18.5
Book Value: ₹166
ROCE: 10.4%
ROE: 13.5%
Quarterly Performance:
Recent results show a 2% revenue increase from 47622 to 48521, highlighting robust performance.
Technical Analysis:
The trendline breakout, coupled with rising volume, suggests a strong upward movement could be imminent. Watch for breakout confirmation to capitalize on potential gains.
Conclusion:
With solid financial metrics and positive quarterly performance, NTPC is a stock to watch closely. Conduct your own analysis and consider risk tolerance before investing.
#StockMarket #Investing #Finance #Trading #StocksToWatch #TechnicalAnalysis #MarketUpdate

NTPC: ATH incoming!NTPC looks promising with rising volumes and some fundamental news. Stock is ready for ATH. Targets as per my study are on TRENDLINES.
NOTE: I'm not a SEBI REG. Study before investing.

VIEW ON NTPCIntraday/BTST call
Good chart
Breakout on the stock
Target 390/397
Stop loss 383
I am just representing my views
For educational purpose only.

Ntpc Limited- Breakout Setup, Move is ON...#NTPC trading above Resistance of 375
Next Resistance is at 515
Support is at 291
Here are previous charts:
Chart is self explanatory. Levels of breakout, possible up-moves (where stock may find resistances) and support (close below which, setup will be invalidated) are clearly defined.
Disclaimer: This is for demonstration and educational purpose only. This is not buying or selling recommendations. I am not SEBI registered. Please consult your financial advisor before taking any trade.

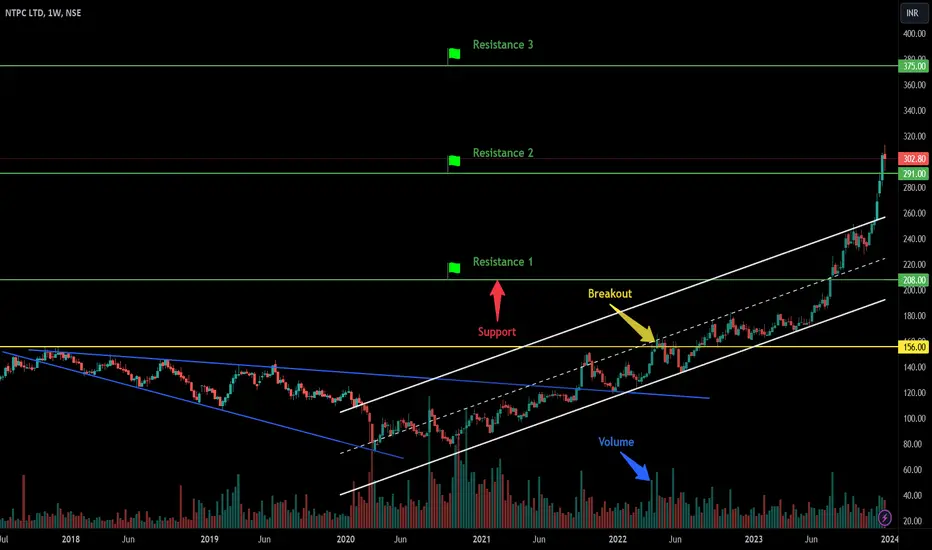
Ntpc Limited- Long Setup, Move is ON...#NTPC trading above Resistance of 291
Next Resistance is at 375
Support is at 208
Here are previous charts:
Chart is self explanatory. Levels of breakout, possible up-moves (where stock may find resistances) and support (close below which, setup will be invalidated) are clearly defined.
Disclaimer: This is for demonstration and educational purpose only. This is not buying or selling recommendations. I am not SEBI registered. Please consult your financial advisor before taking any trade.
NTPC trendline reversalNTPC can have targets of 375+ with SL 358. Its taken taken from the trendline

NTPC FOR INTRADAYNTPC INTRADAY TO SWING
ENTRY - 367
STOPLOSS - 364
TARGETS - 375, 380, 385++
Note- if any trade or value that's gone from the marked levels then that's not our trade just let it go or wait for it to come back
I'm not sebi registered this is my personal view
Please like or boost my idea if you like it or traded it.

NTPC RISING WEDGE BREAKOUTNTPC breaking rising wedge
with huge volue good rsi
power sector firework today
#target 430 soon
EDUCATIONAL IDEA

NTPC - GANN&Wave - More upside leftStock is in an uptrend since it made a low of 73.20.
Recently broke resistance at 182.50 and continuing in wave 5.
Although, on higher timeframes it is giving negative divergence on momentum indicators, still a small quantity can be initiated with strict SL.
Also, the basis of Gann Octaves is an Out of orbit case with a minimum target of 184.50.
The analysis is only for educational purposes. Please trade at your own risk

NTPC CHANNEL PATTERNNTPC CHANNEL PATTERN -- TRENDLINE Support- or Resistance BO
Watch for Trendline support for entry
