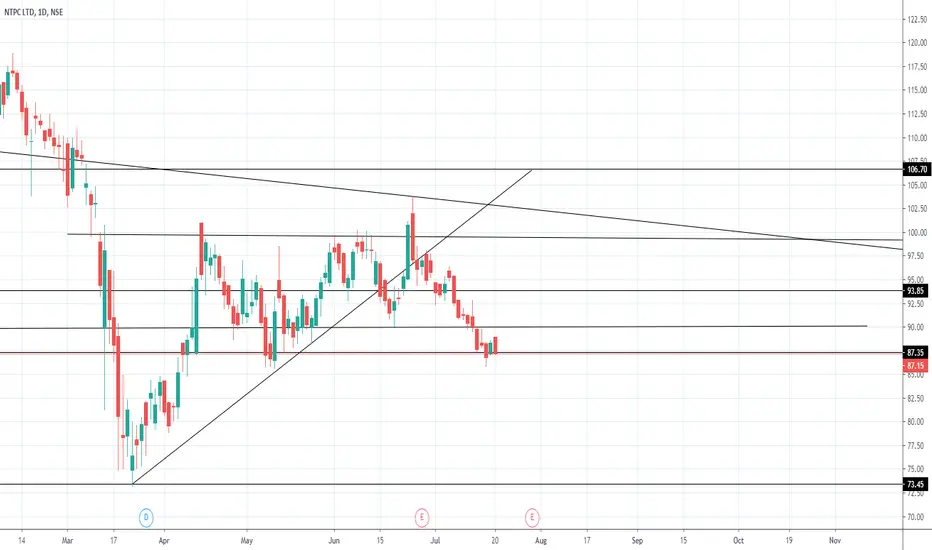
[ POSITIONAL ] NTPC INSIDE BAR RESULTS TRADEAS PER INSIDE BAR THEORY
IF LONG TRIGGERS KEEP SL AS LOW OF THE CANDLE
IF SHORT TRIGGERS KEEP SL AS HIGH OF THE CANDLE
1 ). SUPPORT
2 ) RESULTS RISKY BET
REST AS PER CHART
NTPC trade ideas


Watch out for NTPC.Strong support showing at 86.3 Pe. Check out with 5 minute candles. Hopefully, it can make a good bull run as it have good volume and have made movements in multiple time at this price level.

ShortTested the area multiple times + facing rejections while going up + stock is in long term down trend.
Might be a good short opportunity !

NTPC - DESCENDING TRIANGLE PATTERN#NTPC
#DESCENDINGTRIANGLE
BUY ABOVE UPPER TRENDLINE
SL 86
TGT 100EMA/ 200EMA// 400EMA
SELL BELOW 86.2
SL UPPER TRENDLINE
TGT 85.70/ 84.85/ 84.10

sideway long....the price is trading in the side way,right now it bounce back from the support.so i see a nice risk reward in this trade.do your analysis before making this trade. swing trading risk not more than 3% of your capital........do follow me for more analysis

NTPC - Fib RetracementBuy at CMP for 88, 89, 90 with SL at 87.
Keep trailing SL as Earnings Release can lead to large upward movements.
Please adjust for Future Prices.
or Go Long on Aug 90 CE


NTPC technical analysisAfter a month again the stock is showing a good buying signal with a stop-loss of 86.50.

NTPC flag formation.NTPC flag pole formation in 1 hr timeframe could give a good up-move if crosses 92.5 with volume.

NTPC : Positional The Hammer + NIFTY trend suggests an upward movement is on for tomorrow.
The idea is supported by FIB retracements, both for the recent fall & overall COVID fall.
Positional trades:
Buy above 88.65 for Risk-takers & above 89 for the risk-averse for targets of 90, 91, 92.5 & 94 with SL at 86.8

TRADE THE BREAKOUT AT NTPCIf the breakout occurs with good volume, take long position. Place your targets and stop loss near support and resistance drawn.

NTPC LTD AnalysisBuy 86
Target 90 to 95
Above 89 it is positive trend . So wait for better conformation .

NTPC educational viewNTPC has been steadily falling with average volume falling, meaning that the market makers/smart money are not interested in selling and are waiting for a buying opportunity. Price is near support/accumulation zone and this is where market makers will absorb all the sell order by buying. Falling wedge needs to be broken out for NTPC to move higher.
Target is 100, and after that it may find resistance, due to a psychological level of 100 and a strong resistance/distribution zone.
This is an educational post
Consult your financial advisor before taking trades
I do not recommend taking trades according to my analysis as you may incur loss, for which I am not responsible.
Trade carefully
Grateful🙏

Long NTPC with put option of 88Trade setup in NTPC
Buy NTPC future at cmp for target of 96 with PUT option of 88 if its closes below 88 then square off future poition and hold put option till it reaches to 85 .
Total margin required for this trade around 40K.
Trading in derivative instrument may result t loos of capital.


Buy NTPC for Target of 99.5The stock is trading near the support of curve line.
The stock is trading in between 100 and 90 price.
The stock can be Bullish from this level and can move till 99.5.
Below 88.65 stock can be bearish .


NTPC trade approach:The stock is trading near the support of curve line.
It has already formed a M-top pattern that is double top.
The stock is trading in between 100 and 90 price.
The stock can be Bullish from this level and can move till 95.64.
Below 88.65 stock can be bearish.

NTPC_Short IdeaNTPC is looking good for short. Once it breaches the breakout line it will fall more.
I'm a beginner if anything is wrong pls correct me.

NTPC got breakdown with volumesGap down opening can be a short in trade tomorrow.
This is just an idea,Please Use your head for trading.
