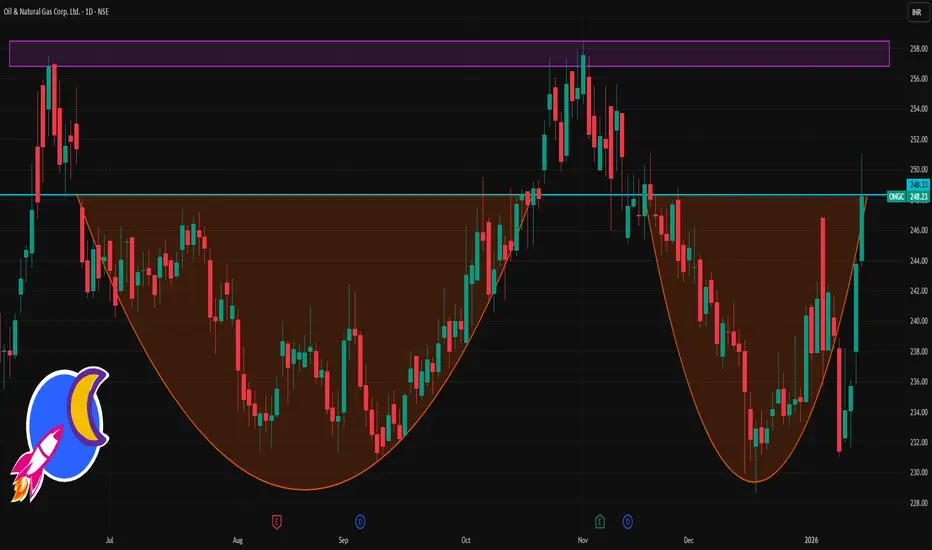
I think chart is telling somethingUnderline asset is above 50,100,200 days MA.
Supertrend is active.
RSI is above 50
MACD is above zero line.
Volume breakout at 50 days MA.
Next report date
—
Report period
—
EPS estimate
—
Revenue estimate
—
30.15 INR
362.26 B INR
6.12 T INR
3.87 B
About Oil & Natural Gas Corp. Ltd.
Sector
Industry
CEO
Arun Kumar Singh
Website
Headquarters
New Delhi
Founded
1956
IPO date
Aug 9, 1995
Identifiers
2
ISIN INE213A01029
Oil and Natural Gas Corporation Limited is a global energy holding company. The Company is engaged in the exploration, development and production of crude oil and natural gas. The Company's segments include Exploration & Production (E&P), and Refining. The Company's geographical segments include operations in two categories: In India, which includes Onshore and Offshore, and Outside India. The Company's business spread include various areas, such as oil field services, transportation of the oil and natural gas, and production of value-added products, such as Liquefied Petroleum Gas (LPG), Naphtha, Refining, Petrochemicals, Power, unconventional and alternate sources of energy. The Company's subsidiaries include ONGC Videsh Limited (OVL), Mangalore Refinery and Petrochemicals Limited (MRPL) and ONGC Mangalore Petrochemicals Limited. The Company's oil and gas reserves are located internationally at Russia, Colombia, Vietnam, Brazil and Venezuela.
Related stocks

ONGC 1 Day Time Frame 📌 Live Price Snapshot (Latest Available)
Current Price (approx): ₹244 – ₹248 range on NSE today (near ₹248)
Day Low / Day High (intraday): ~₹244 / ₹251
Price may vary slightly based on live market data at the moment.
📊 Daily Pivot‑Based Levels (for Today’s Price Action)
Daily Pivot / Reference Po
ONGC (Oil and Natural Gas Corporation)ONGC is purely an "upstream" company, whose work involves extracting oil and gas from deep within the earth and sea.
Saturn: This is ONGC's most dominant planet. Drilling, mining, and extracting raw materials are the primary functions associated with Saturn.
Mars : The technical prowess and c

ONGC 1 Month Time Frame 📌 Current snapshot
ONGC last traded around ₹243–₹244.
Over the past month, the stock has dropped ~3–4%.
📈 What could happen in next month
Bearish scenario: If price slips below ₹241 and sentiment (oil prices, global energy demand, investor flows) remains weak — ONGC could test the lower support
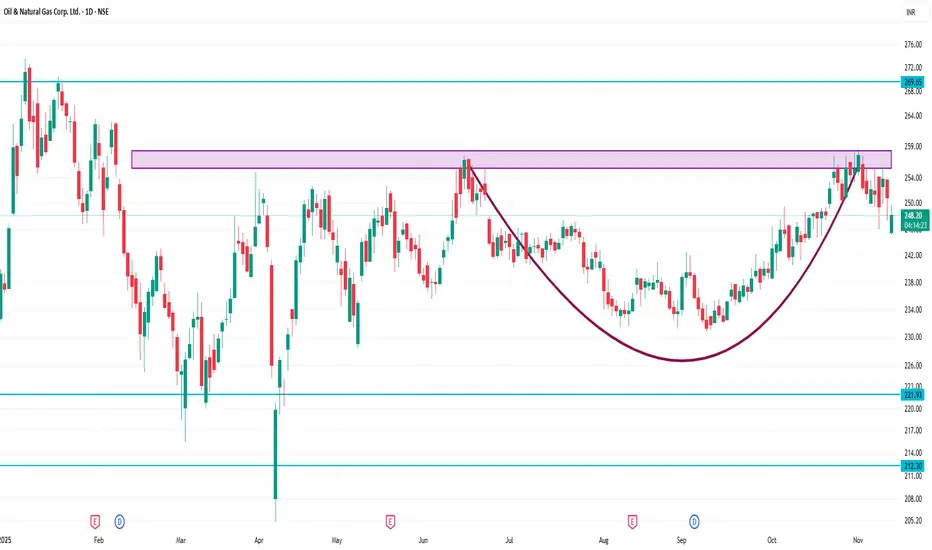
ONGC 1 Day Time Frame 🎯 Key levels to watch on the 1-day chart
Support zone: ~ ₹ 245-243 region (falls in line with support zones and moving average base)
Near support: ~ ₹ 248-250 (if price returns toward pivot/support)
Resistance zone: ~ ₹ 253-257 region (prior resistance, pivot R1, chart resistance).
If ONGC break
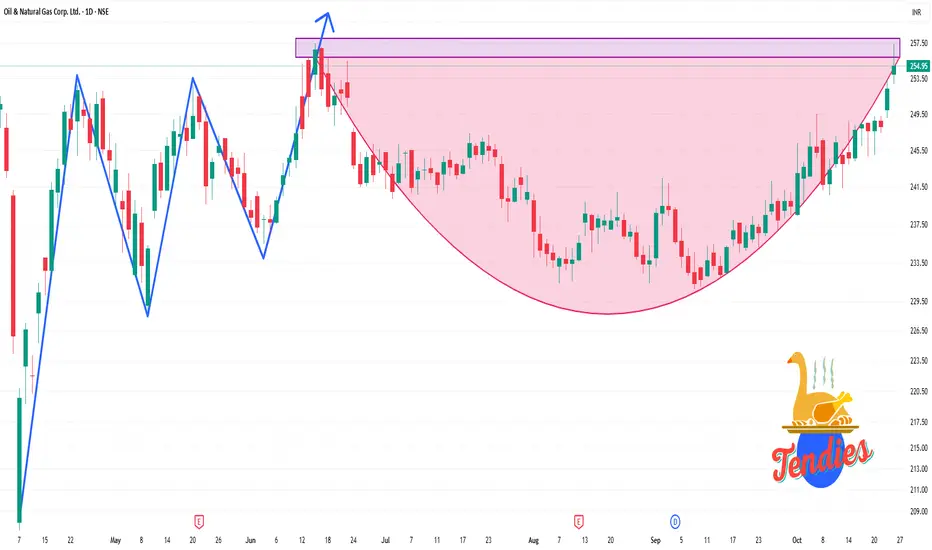
ONGC (Swing Tread Idea )ONGC - BUY
Current Market Price: ₹254.95
Entry Price Range: ₹250-251
Justification for Entry: Bullish MACD;RSI(14);rebounding ~7.7%
Exit Price/Profit-Booking Zone: ₹260-270
Position Sizing: ₹1 lakh (~400 shares)
Risk-Reward Ratio: 1:1.8
Stop-Loss: ₹247
Target Prices (1-2 Weeks): ₹260, ₹275

ONGC 1 Day Time Frame 📈 Current Price & Trend
Current Price: ₹256.09
Day Range: ₹252.85 – ₹257.40
52-Week Range: ₹205.00 – ₹274.35
Market Cap: ₹3.21 trillion
P/E Ratio: 8.92
Dividend Yield: 4.80%
Beta: 1.05 (suggesting average market volatility)
🔍 Technical Indicators (Daily Time Frame)
RSI (14-day): 75.67 – Ind
Continuation Diamond (Bullish) – ONGC Ltd. (NSE: ONGC)📊 Continuation Diamond (Bullish)
Pattern Type: Bullish Continuation
🧩 Pattern Insight:
The Continuation Diamond (Bullish) pattern forms when a strong uptrend pauses temporarily, creating a diamond-shaped consolidation before resuming higher. This indicates that the market is taking a breather whi

ONGC Price ActionAs of October 23, 2025, **ONGC (Oil and Natural Gas Corporation Limited)** closed at approximately **₹252.31**, up about **1.69%** from the previous close of ₹248.12. The stock traded within a day range of ₹249.08 to ₹253.24, indicating positive intraday momentum.
The company has a strong market ca
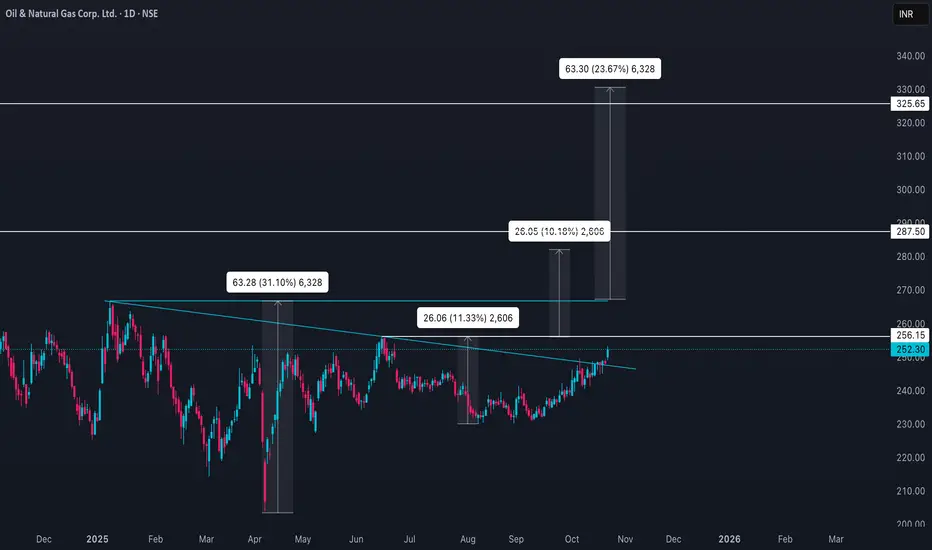
Triple bottom setup on weekly supportNSE:ONGC
Triple bottom setup on weekly support, price started moving upward slowly, with some big spikes in volume. This is very good setup. If this continues, one can expect first tartget at 242 and second target on 252.
See all ideas
Summarizing what the indicators are suggesting.
Neutral
SellBuy
Strong sellStrong buy
Strong sellSellNeutralBuyStrong buy
Neutral
SellBuy
Strong sellStrong buy
Strong sellSellNeutralBuyStrong buy
Neutral
SellBuy
Strong sellStrong buy
Strong sellSellNeutralBuyStrong buy
An aggregate view of professional's ratings.
Neutral
SellBuy
Strong sellStrong buy
Strong sellSellNeutralBuyStrong buy
Neutral
SellBuy
Strong sellStrong buy
Strong sellSellNeutralBuyStrong buy
Neutral
SellBuy
Strong sellStrong buy
Strong sellSellNeutralBuyStrong buy
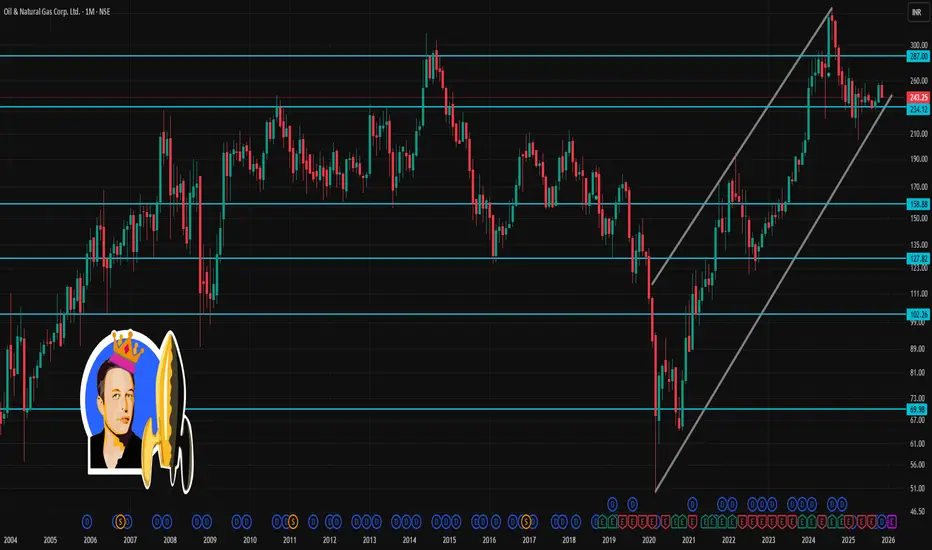
Displays a symbol's price movements over previous years to identify recurring trends.
O
858OPAL29
ONGC Petro Additions Limited 8.58% 09-NOV-2029Yield to maturity
6.87%
Maturity date
Nov 9, 2029
RPIN4933146
Oil and Natural Gas Corporation Limited 3.375% 05-DEC-2029Yield to maturity
4.37%
Maturity date
Dec 5, 2029
O
RPIN4398733
ONGC Videsh Vankorneft Pte. Ltd. 3.75% 27-JUL-2026Yield to maturity
4.29%
Maturity date
Jul 27, 2026
64ONGC31
Oil and Natural Gas Corporation Limited 6.4% 11-APR-2031Yield to maturity
—
Maturity date
Apr 11, 2031
See all ONGC bonds
Frequently Asked Questions
The current price of ONGC is 267.40 INR — it has decreased by −3.24% in the past 24 hours. Watch Oil & Natural Gas Corp. Ltd. stock price performance more closely on the chart.
Depending on the exchange, the stock ticker may vary. For instance, on NSE exchange Oil & Natural Gas Corp. Ltd. stocks are traded under the ticker ONGC.
ONGC stock has fallen by −0.22% compared to the previous week, the month change is a 9.59% rise, over the last year Oil & Natural Gas Corp. Ltd. has showed a 12.12% increase.
We've gathered analysts' opinions on Oil & Natural Gas Corp. Ltd. future price: according to them, ONGC price has a max estimate of 330.00 INR and a min estimate of 200.00 INR. Watch ONGC chart and read a more detailed Oil & Natural Gas Corp. Ltd. stock forecast: see what analysts think of Oil & Natural Gas Corp. Ltd. and suggest that you do with its stocks.
ONGC reached its all-time high on Aug 13, 2024 with the price of 345.00 INR, and its all-time low was 10.55 INR and was reached on May 9, 2000. View more price dynamics on ONGC chart.
See other stocks reaching their highest and lowest prices.
See other stocks reaching their highest and lowest prices.
ONGC stock is 3.89% volatile and has beta coefficient of 1.16. Track Oil & Natural Gas Corp. Ltd. stock price on the chart and check out the list of the most volatile stocks — is Oil & Natural Gas Corp. Ltd. there?
Today Oil & Natural Gas Corp. Ltd. has the market capitalization of 3.37 T, it has increased by 3.66% over the last week.
Yes, you can track Oil & Natural Gas Corp. Ltd. financials in yearly and quarterly reports right on TradingView.
Oil & Natural Gas Corp. Ltd. is going to release the next earnings report on May 21, 2026. Keep track of upcoming events with our Earnings Calendar.
ONGC earnings for the last quarter are 7.96 INR per share, whereas the estimation was 5.83 INR resulting in a 36.62% surprise. The estimated earnings for the next quarter are 5.31 INR per share. See more details about Oil & Natural Gas Corp. Ltd. earnings.
Oil & Natural Gas Corp. Ltd. revenue for the last quarter amounts to 1.67 T INR, despite the estimated figure of 315.83 B INR. In the next quarter, revenue is expected to reach 1.06 T INR.
ONGC net income for the last quarter is 100.16 B INR, while the quarter before that showed 107.85 B INR of net income which accounts for −7.13% change. Track more Oil & Natural Gas Corp. Ltd. financial stats to get the full picture.
Oil & Natural Gas Corp. Ltd. dividend yield was 4.97% in 2024, and payout ratio reached 42.54%. The year before the numbers were 4.57% and 31.36% correspondingly. See high-dividend stocks and find more opportunities for your portfolio.
As of Feb 15, 2026, the company has 25.32 K employees. See our rating of the largest employees — is Oil & Natural Gas Corp. Ltd. on this list?
EBITDA measures a company's operating performance, its growth signifies an improvement in the efficiency of a company. Oil & Natural Gas Corp. Ltd. EBITDA is 1.10 T INR, and current EBITDA margin is 16.58%. See more stats in Oil & Natural Gas Corp. Ltd. financial statements.
Like other stocks, ONGC shares are traded on stock exchanges, e.g. Nasdaq, Nyse, Euronext, and the easiest way to buy them is through an online stock broker. To do this, you need to open an account and follow a broker's procedures, then start trading. You can trade Oil & Natural Gas Corp. Ltd. stock right from TradingView charts — choose your broker and connect to your account.
Investing in stocks requires a comprehensive research: you should carefully study all the available data, e.g. company's financials, related news, and its technical analysis. So Oil & Natural Gas Corp. Ltd. technincal analysis shows the buy rating today, and its 1 week rating is strong buy. Since market conditions are prone to changes, it's worth looking a bit further into the future — according to the 1 month rating Oil & Natural Gas Corp. Ltd. stock shows the buy signal. See more of Oil & Natural Gas Corp. Ltd. technicals for a more comprehensive analysis.
If you're still not sure, try looking for inspiration in our curated watchlists.
If you're still not sure, try looking for inspiration in our curated watchlists.