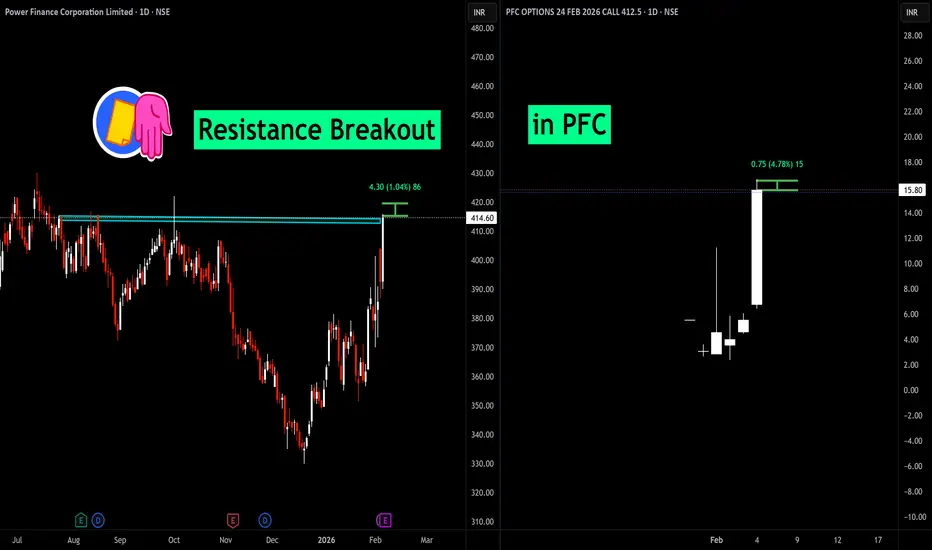
PFC: Crucial Pivot at 415.60PFC is currently testing a significant resistance zone after a healthy uptrend. The price has formed a reliable triple bottom support near 406, suggesting that the downside is currently well-defended. However, the momentum is capped under 415.60. We are looking for a decisive and sustained price act
Next report date
—
Report period
—
EPS estimate
—
Revenue estimate
—
76.40 INR
229.91 B INR
1.07 T INR
1.45 B
About Power Finance Corporation Limited
Sector
Industry
CEO
Parminder Chopra
Website
Headquarters
New Delhi
Founded
1986
IPO date
Feb 26, 2007
Identifiers
2
ISIN INE134E01011
Power Finance Corp. Ltd. is a non-banking financial company, which engages in the provision of financial assistance to the power sector. It offers fund-based and non-fund-based policies, and non-fund-based consultancy services. The company was founded on July 16, 1986 and is headquartered in New Delhi, India.
Related stocks

BUY TODAY SELL TOMORROW for 5% - BTST STOCK OPTIONDON’T HAVE TIME TO MANAGE YOUR TRADES?
- Take BTST Stock Option trades at 3:25 pm every day
- Try to exit by taking 4-7% profit of each trade
-Resistance Breakout in PFC
BUY TODAY, SELL TOMORROW for 5%
PFC:Likely Huge Trend Line Break OutPFC:
Trading at 419 and above all its Moving averages in daily chart viz 10,20,50,100 DEMA
Has given Golden crossover of 10 DEMA in Daily chart
Sustained increase in volume -latest two weeks noticed
Trading at 419 and above its Trend line resistance
Combination of the above suggests a possible upsid

PFC 1 Day Time Frame 📌 Current Market Price (Approx intraday)
• ~₹414–₹418 on NSE (trading range today: ₹413.10 – ₹420.40) as per real-time quotes.
📊 Key Daily Pivot & Levels (1-Day Timeframe)
🔹 Daily Pivot Reference (CPR / Pivot Zone)
• Central Pivot (CPR) / Pivot area: ~₹406.8 – ₹410.7 (bias reference)
📈 Resistance

PFCPFC
bullish trend is Showing on the chart.
buy signals in
technical indicators and
Descending Channel Pattern.
BUYING RANGE 403/405
Watch for a retest 403/405 to sustain the bullish trend. If the resistance holds, there could be a retest towards 325/330 and an uptrend from here.

PFC 1 Day Time Frame 📌 Current Live Context (Daily)
📊 Approx Live Price: ~₹377‑₹379 (today’s trading range: ₹376 – ₹384) on NSE intraday quotes.
📈 Daily Pivot / Support & Resistance (Reliable Levels)
🔹 Pivot / Reference Zone
Central Pivot (CPR) ~ ₹386.8 area — key reference point for bias (above = bullish bias; below

PFC 1 Day Time Frame 📊 Daily Pivot Levels
Pivot Point (Daily): ~₹343.00–₹343.30
Central Pivot (CPR):
• Top: ₹343.60
• Mid: ₹343.00
• Bottom: ₹342.40
📈 Resistance Levels (Daily)
R1: ~₹344–₹346
R2: ~₹347–₹348
R3: ~₹350–₹351
📉 Support Levels (Daily)
S1: ~₹338–₹341 (minor support)
S2: ~

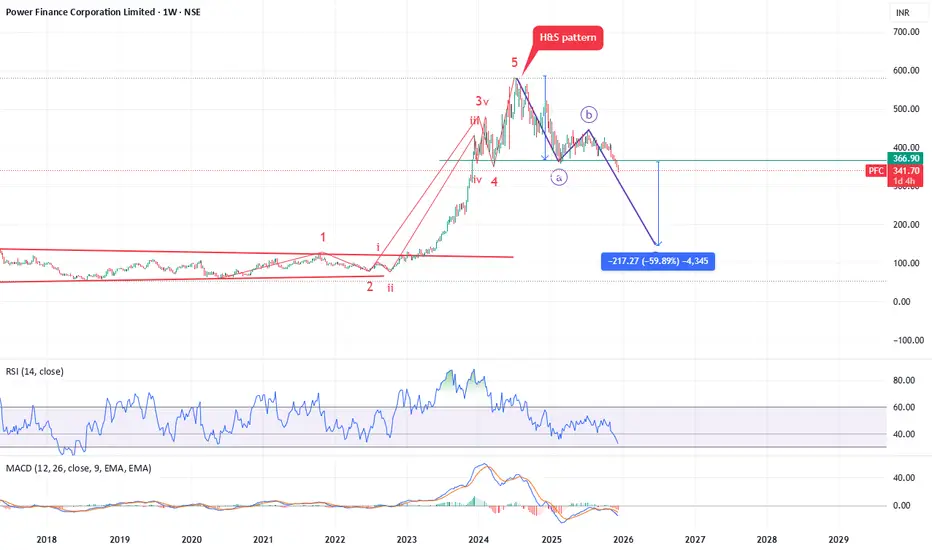
Elliott Wave Interpretation of PFC chart.Elliott Wave Interpretation of PFC chart.
Your chart shows a full 5-wave impulse completed on the weekly timeframe:
Wave 1 → 2 → 3 → 4 → 5 completed around mid-2024
Wave 5 shows exhaustion + RSI divergence → confirms top
A Head & Shoulders pattern formed near the Wave 5 top
After completion of
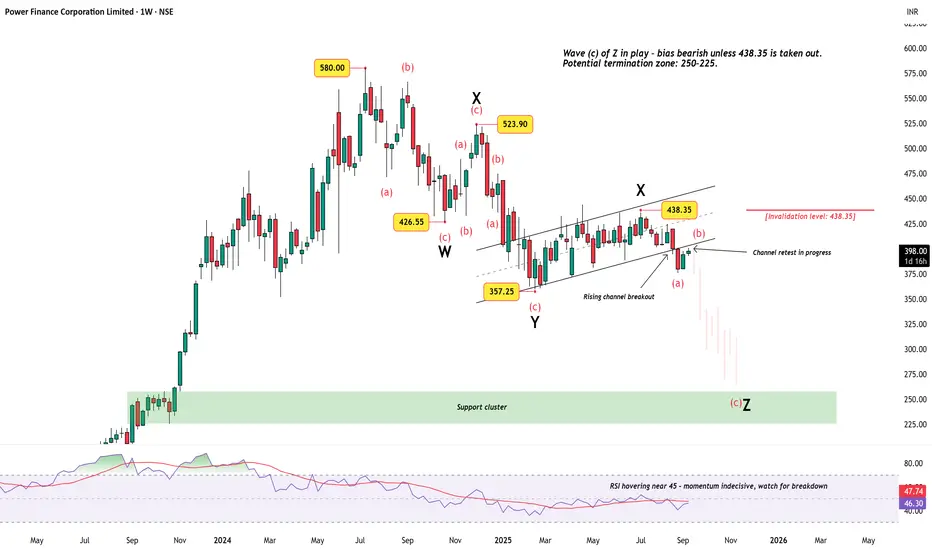
Power Finance Corporation – Complex Correction Still in PlayAfter topping out near ₹580, Power Finance Corporation (PFC) has been locked in a prolonged corrective structure. The price action since mid-2023 suggests a triple correction (W-X-Y-X-Z) , with the final leg (Wave Z) now unfolding.
Technical View
Price broke down from a rising channel and is
PFC: Golden Zone Rejection + Demand Support = Reversal?⚡ POWER FINANCE CORP (PFC) – Wave 4 Correction Ending | Demand Zone Reversal Setup!
🧠 Chart Context & Wave Overview
The chart of Power Finance Corporation Ltd (Daily Timeframe) shows a well-structured Elliott Wave corrective pattern (a-b-c) , where price has likely completed its Wave 4 corr

See all ideas
Summarizing what the indicators are suggesting.
Neutral
SellBuy
Strong sellStrong buy
Strong sellSellNeutralBuyStrong buy
Neutral
SellBuy
Strong sellStrong buy
Strong sellSellNeutralBuyStrong buy
Neutral
SellBuy
Strong sellStrong buy
Strong sellSellNeutralBuyStrong buy
An aggregate view of professional's ratings.
Neutral
SellBuy
Strong sellStrong buy
Strong sellSellNeutralBuyStrong buy
Neutral
SellBuy
Strong sellStrong buy
Strong sellSellNeutralBuyStrong buy
Neutral
SellBuy
Strong sellStrong buy
Strong sellSellNeutralBuyStrong buy
Displays a symbol's price movements over previous years to identify recurring trends.
779PFCL30
Power Finance Corporation Limited 7.79% 22-JUL-2030Yield to maturity
12.88%
Maturity date
Jul 22, 2030
663PFCL31
Power Finance Corporation Limited 6.63% 22-JAN-2031Yield to maturity
8.51%
Maturity date
Jan 22, 2031
885PFCL29
Power Finance Corporation Limited 8.85% 25-MAY-2029Yield to maturity
8.19%
Maturity date
May 25, 2029
946PFCL26
Power Finance Corporation Limited 9.46% 01-AUG-2026Yield to maturity
8.01%
Maturity date
Aug 1, 2026
697PFCL36
Power Finance Corporation Limited 6.97% 22-JAN-2036Yield to maturity
7.72%
Maturity date
Jan 22, 2036
7PFCL31
Power Finance Corporation Limited 7.0% 22-JAN-2031Yield to maturity
7.71%
Maturity date
Jan 22, 2031
715PFCL36
Power Finance Corporation Limited 7.15% 22-JAN-2036Yield to maturity
7.38%
Maturity date
Jan 22, 2036
755PFCL38
Power Finance Corporation Limited 7.55% 01-AUG-2038Yield to maturity
6.97%
Maturity date
Aug 1, 2038
682PFCL31
Power Finance Corporation Limited 6.82% 22-JAN-2031Yield to maturity
6.96%
Maturity date
Jan 22, 2031
695PFCL36
Power Finance Corporation Limited 6.95% 22-JAN-2036Yield to maturity
6.94%
Maturity date
Jan 22, 2036
885PFCL30
Power Finance Corporation Limited 8.85% 15-JUN-2030Yield to maturity
6.80%
Maturity date
Jun 15, 2030
See all PFC bonds
Frequently Asked Questions
The current price of PFC is 411.80 INR — it has increased by 1.02% in the past 24 hours. Watch Power Finance Corporation Limited stock price performance more closely on the chart.
Depending on the exchange, the stock ticker may vary. For instance, on NSE exchange Power Finance Corporation Limited stocks are traded under the ticker PFC.
PFC stock has fallen by −4.79% compared to the previous week, the month change is a 8.22% rise, over the last year Power Finance Corporation Limited has showed a 6.75% increase.
We've gathered analysts' opinions on Power Finance Corporation Limited future price: according to them, PFC price has a max estimate of 560.00 INR and a min estimate of 425.00 INR. Watch PFC chart and read a more detailed Power Finance Corporation Limited stock forecast: see what analysts think of Power Finance Corporation Limited and suggest that you do with its stocks.
PFC stock is 4.03% volatile and has beta coefficient of 1.67. Track Power Finance Corporation Limited stock price on the chart and check out the list of the most volatile stocks — is Power Finance Corporation Limited there?
Today Power Finance Corporation Limited has the market capitalization of 1.32 T, it has increased by 5.76% over the last week.
Yes, you can track Power Finance Corporation Limited financials in yearly and quarterly reports right on TradingView.
Power Finance Corporation Limited is going to release the next earnings report on May 27, 2026. Keep track of upcoming events with our Earnings Calendar.
PFC earnings for the last quarter are 14.43 INR per share, whereas the estimation was 11.69 INR resulting in a 23.41% surprise. The estimated earnings for the next quarter are 14.79 INR per share. See more details about Power Finance Corporation Limited earnings.
Power Finance Corporation Limited revenue for the last quarter amounts to 63.31 B INR, despite the estimated figure of 58.88 B INR. In the next quarter, revenue is expected to reach 67.87 B INR.
PFC net income for the last quarter is 62.92 B INR, while the quarter before that showed 57.43 B INR of net income which accounts for 9.56% change. Track more Power Finance Corporation Limited financial stats to get the full picture.
Power Finance Corporation Limited dividend yield was 3.81% in 2024, and payout ratio reached 22.68%. The year before the numbers were 3.46% and 22.54% correspondingly. See high-dividend stocks and find more opportunities for your portfolio.
As of Feb 16, 2026, the company has 755 employees. See our rating of the largest employees — is Power Finance Corporation Limited on this list?
EBITDA measures a company's operating performance, its growth signifies an improvement in the efficiency of a company. Power Finance Corporation Limited EBITDA is 433.30 B INR, and current EBITDA margin is 95.44%. See more stats in Power Finance Corporation Limited financial statements.
Like other stocks, PFC shares are traded on stock exchanges, e.g. Nasdaq, Nyse, Euronext, and the easiest way to buy them is through an online stock broker. To do this, you need to open an account and follow a broker's procedures, then start trading. You can trade Power Finance Corporation Limited stock right from TradingView charts — choose your broker and connect to your account.
Investing in stocks requires a comprehensive research: you should carefully study all the available data, e.g. company's financials, related news, and its technical analysis. So Power Finance Corporation Limited technincal analysis shows the strong buy rating today, and its 1 week rating is buy. Since market conditions are prone to changes, it's worth looking a bit further into the future — according to the 1 month rating Power Finance Corporation Limited stock shows the buy signal. See more of Power Finance Corporation Limited technicals for a more comprehensive analysis.
If you're still not sure, try looking for inspiration in our curated watchlists.
If you're still not sure, try looking for inspiration in our curated watchlists.