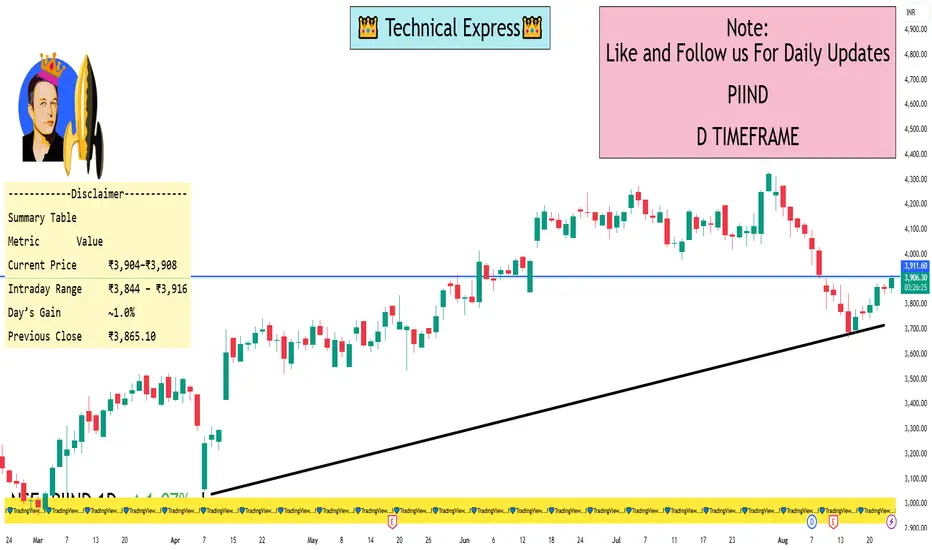
PI Industries 1 Day ViewIntraday Snapshot
Latest Price:
As per Investing.com, the price on August 25, 2025, stood at ₹3,903.80, marking a 1.00% gain for the day
Moneycontrol shows a pre-opening/early trading figure of ₹3,907.70, up roughly 1.10%
Daily Price Range:
Highest: ₹3,915.80
Lowest: ₹3,844.10
Previous Close:
Next report date
—
Report period
—
EPS estimate
—
Revenue estimate
—
106.20 INR
16.60 B INR
79.08 B INR
81.14 M
About PI Industries Limited
Sector
Industry
Website
Headquarters
Gurgaon
Founded
1946
ISIN
INE603J01030
FIGI
BBG000CXGMM3
PI Industries Ltd. engages in the manufacturing and selling of agro-inputs, which comprises of crop protection chemicals and plant growth nutrients. Its products include insecticides, fungicides, and herbicides. The firm also focuses on activities, such as research and development, market research, and investment. The company was founded by P. P. Singhal in 1946 and is headquartered in Gurgaon, India.
Related stocks
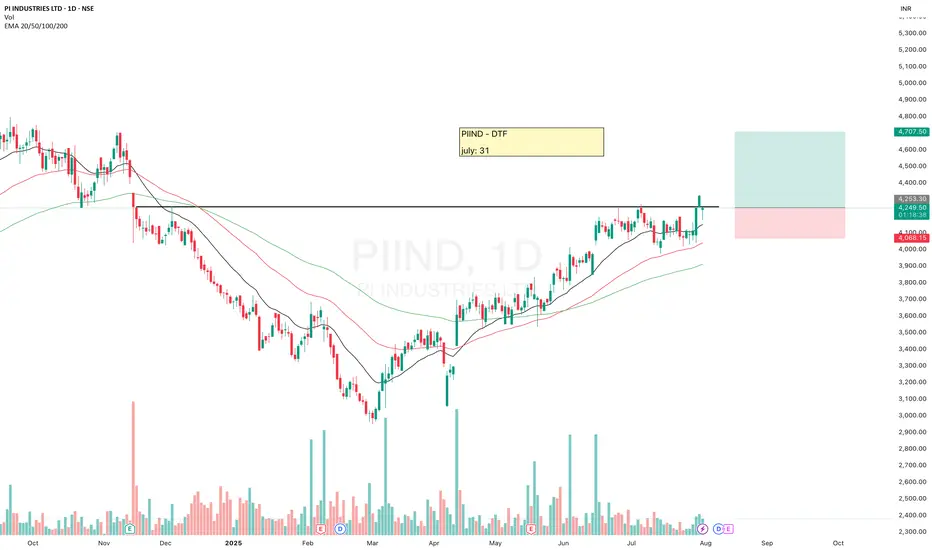
PIINDPIIND is looking good.
It has made HH-HL formation, moving above 20ema and breakout from here may give a good upside move. Keep eyes on it.
✅ If you like my analysis, please follow me here as a token of appreciation :)
in.tradingview.com/u/SatpalS/
📌 For learning and educational purposes only,
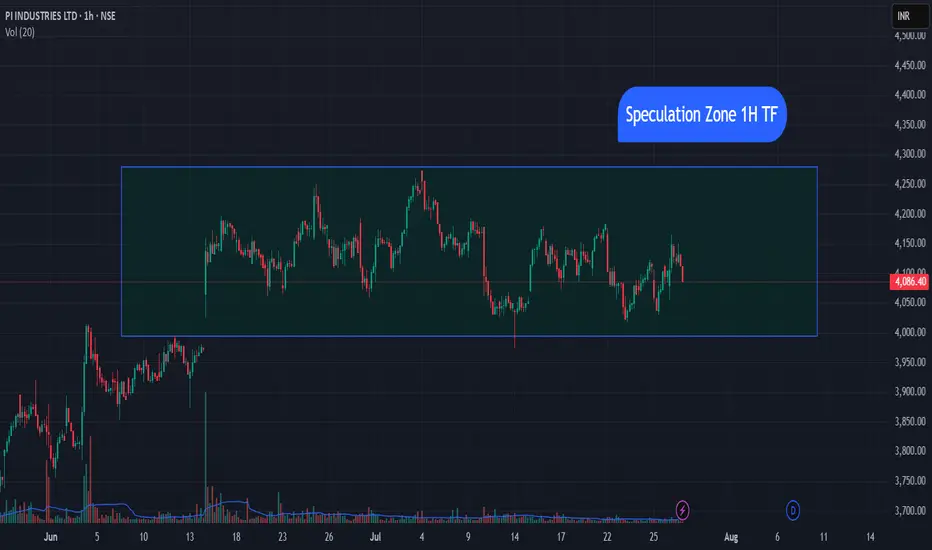
PIIND chart If you Watching PI ind chart its showing Speculation Zone so W8 Confirmation next Movement 4200 Resistance and 4000 Support NOt for Trading only For Study
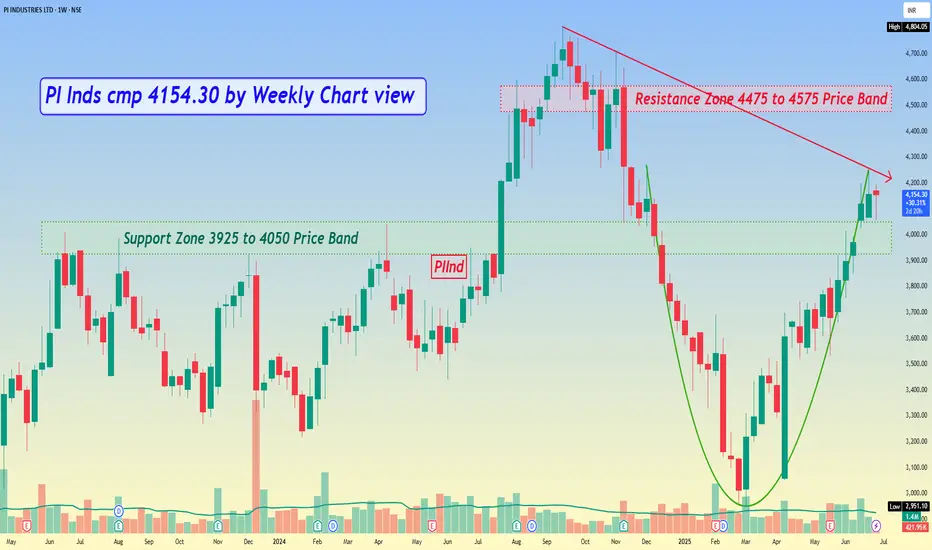
PI Inds cmp 4154.30 by Weekly Chart view*PI Inds cmp 4154.30 by Weekly Chart view*
- Support Zone 3925 to 4050 Price Band
- Resistance Zone 4475 to 4575 Price Band
- Bullish Rounding Bottom done above Support Zone
- Falling Resistance Trendline Breakout awaited to happen
- Support Zone been tested and retested for upside reversal
- Techn
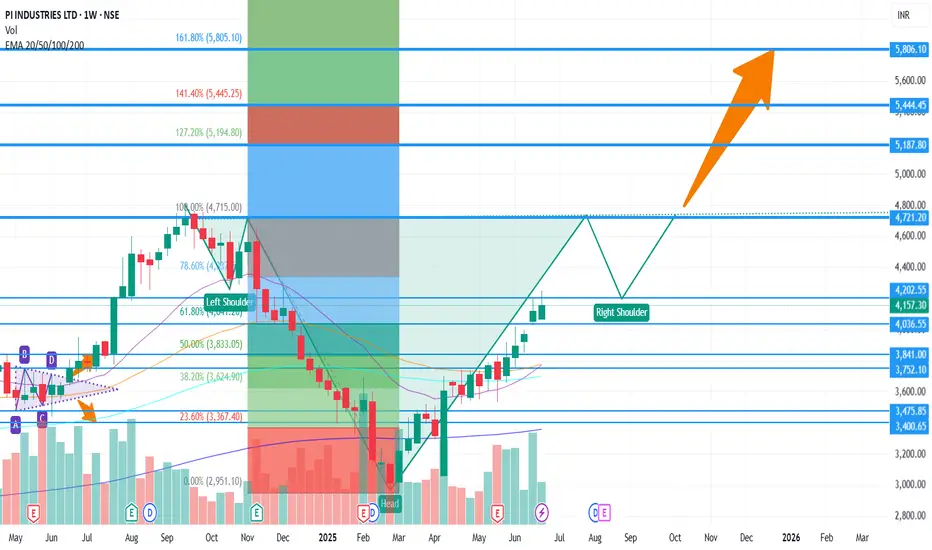
Long PIIND - Target 5800PIIND on weekly chart is forming Inverted Head and Shoulders Pattern.
The stop loss is low of the Head.
Target 1 - 4800
Target 2 - 5300
Target 3 - 5800
PI Industries Ltd. PI Industries Ltd. operates a diversified business model centered on agrochemicals, specialty chemicals, and custom synthesis and manufacturing (CSM), with a focus on innovation, research, and global partnerships.
1. Core Business Segments
Agrochemicals (Domestic and Export):
Domestic Market: PI In
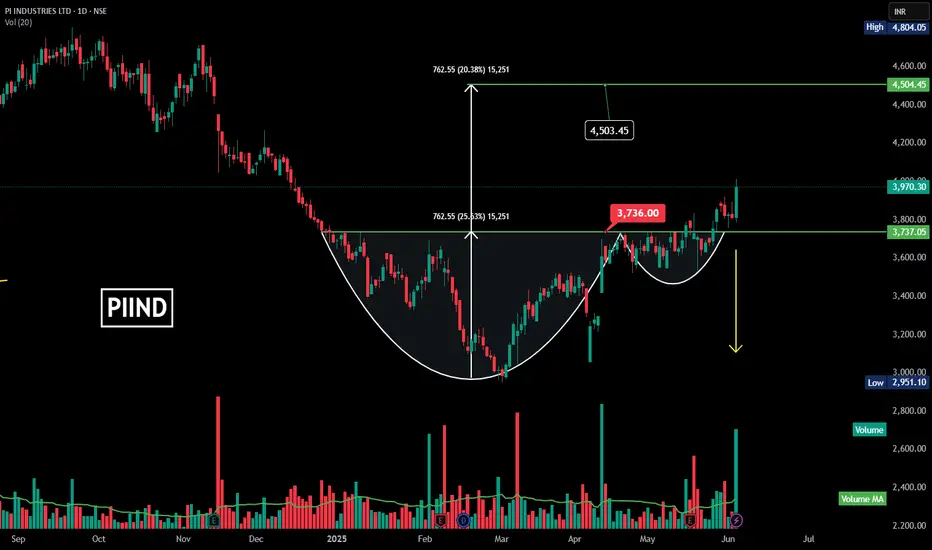
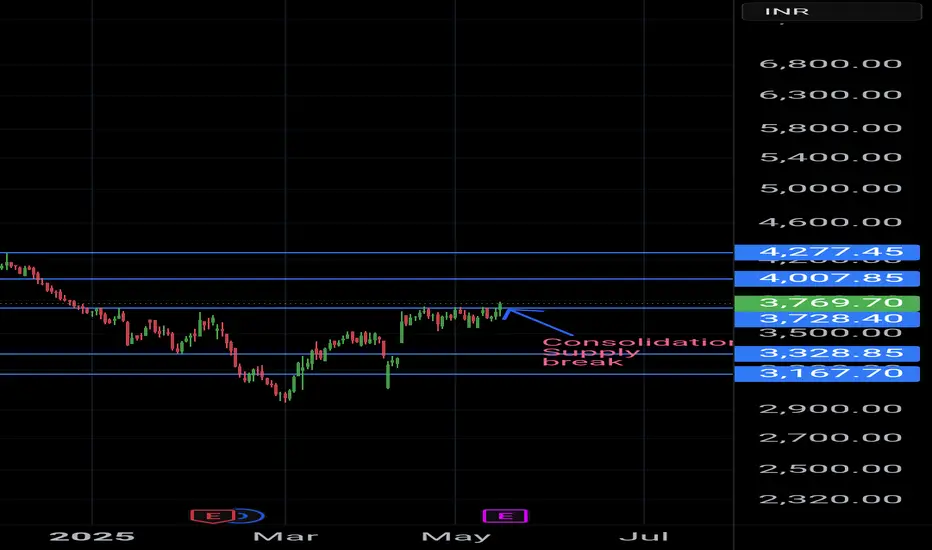
PIIND | Cup and Handle | Breakout | Good volume
**Stock:** PI INDUSTRIES LTD (PIIND)
**Chart Type:** Daily chart
**Pattern:** Cup and Handle formation
✅ **Key Technical Highlights:**
* A cup and handle pattern has formed, signaling a potential bullish breakout.
* Breakout level (resistance) is around ₹3,736, which has been successfully breache
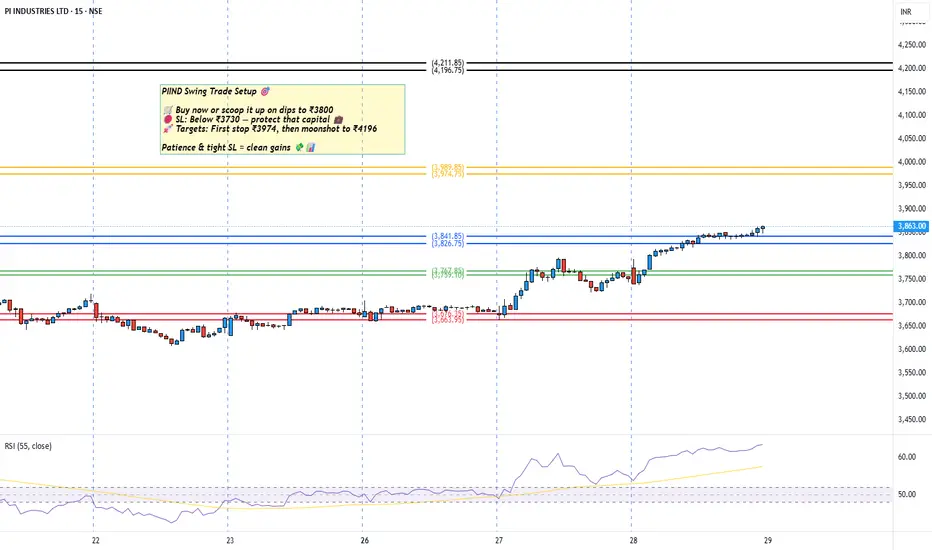
PIIND Swing Trade SetupPIIND Swing Trade Setup 🎯
🛒 Buy now or scoop it up on dips to ₹3800
🛑 SL: Below ₹3730 — protect that capital 💼
🚀 Targets: First stop ₹3974, then moonshot to ₹4196
Patience & tight SL = clean gains 💸📊
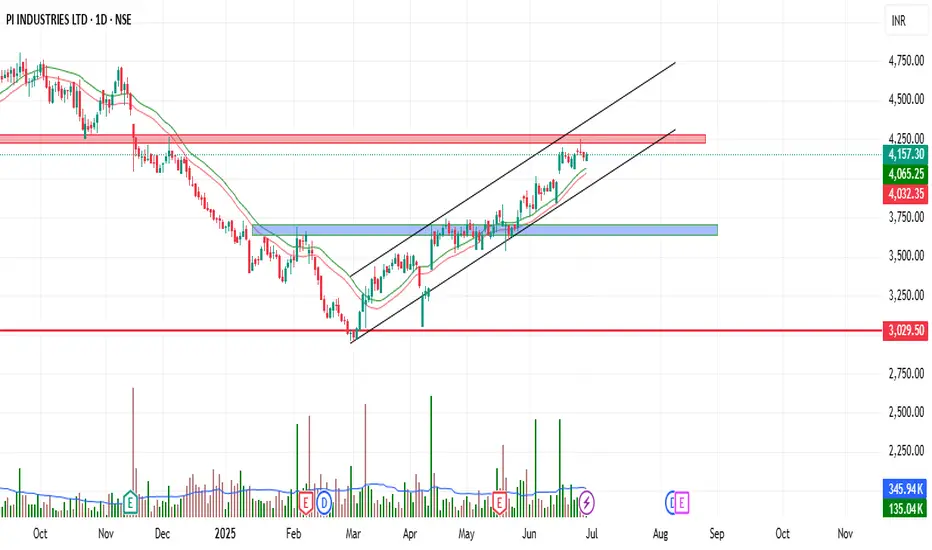
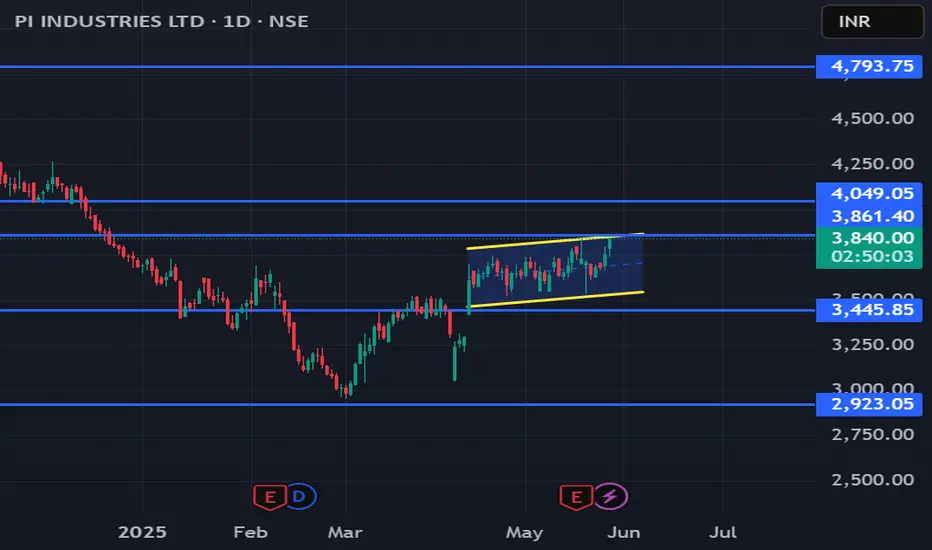
PIIND: Channel Breakout Above 3840Details:
Asset: PI Industries Ltd (PIIND)
Breakout Level: 3840
Potential Targets: 4000, 4500, 4700
Stop Loss: 3740
Timeframe: Short to Medium Term
Rationale: PIIND has broken out from a well-defined ascending channel on the daily chart. The breakout above 3840 is supported by strong volume and
See all ideas
Summarizing what the indicators are suggesting.
Neutral
SellBuy
Strong sellStrong buy
Strong sellSellNeutralBuyStrong buy
Neutral
SellBuy
Strong sellStrong buy
Strong sellSellNeutralBuyStrong buy
Neutral
SellBuy
Strong sellStrong buy
Strong sellSellNeutralBuyStrong buy
An aggregate view of professional's ratings.
Neutral
SellBuy
Strong sellStrong buy
Strong sellSellNeutralBuyStrong buy
Neutral
SellBuy
Strong sellStrong buy
Strong sellSellNeutralBuyStrong buy
Neutral
SellBuy
Strong sellStrong buy
Strong sellSellNeutralBuyStrong buy
Displays a symbol's price movements over previous years to identify recurring trends.
GUNR
FlexShares Morningstar Global Upstream Natural Resources Index FundWeight
0.67%
Market value
35.05 M
USD
EEDM
iShares IV PLC - iShares MSCI EM ESG Enhanced CTB UCITS ETF Unhedged USDWeight
0.16%
Market value
13.27 M
USD
AMEG
Amundi MSCI Emerging Markets SRI Climate Paris Aligned -UCITS ETF DR- DistributionWeight
0.39%
Market value
10.25 M
USD
MSDU
Amundi MSCI Emerging Markets SRI Climate Paris Aligned UCITS ETF DR (D)Weight
0.39%
Market value
10.25 M
USD
AMEI
Amundi MSCI Emerging Markets SRI Climate Paris Aligned UCITS ETF DR C- CapitalisationWeight
0.39%
Market value
10.25 M
USD
Explore more ETFs
Frequently Asked Questions
The current price of PIIND is 3,761.50 INR — it has increased by 0.22% in the past 24 hours. Watch PI Industries Limited stock price performance more closely on the chart.
Depending on the exchange, the stock ticker may vary. For instance, on NSE exchange PI Industries Limited stocks are traded under the ticker PIIND.
PIIND stock has risen by 4.58% compared to the previous week, the month change is a 4.25% rise, over the last year PI Industries Limited has showed a −20.14% decrease.
We've gathered analysts' opinions on PI Industries Limited future price: according to them, PIIND price has a max estimate of 6,500.00 INR and a min estimate of 2,800.00 INR. Watch PIIND chart and read a more detailed PI Industries Limited stock forecast: see what analysts think of PI Industries Limited and suggest that you do with its stocks.
PIIND reached its all-time high on Sep 20, 2024 with the price of 4,804.05 INR, and its all-time low was 68.00 INR and was reached on Jun 21, 2011. View more price dynamics on PIIND chart.
See other stocks reaching their highest and lowest prices.
See other stocks reaching their highest and lowest prices.
PIIND stock is 0.80% volatile and has beta coefficient of 0.99. Track PI Industries Limited stock price on the chart and check out the list of the most volatile stocks — is PI Industries Limited there?
Today PI Industries Limited has the market capitalization of 569.91 B, it has decreased by −0.69% over the last week.
Yes, you can track PI Industries Limited financials in yearly and quarterly reports right on TradingView.
PI Industries Limited is going to release the next earnings report on Nov 11, 2025. Keep track of upcoming events with our Earnings Calendar.
PIIND earnings for the last quarter are 26.30 INR per share, whereas the estimation was 30.47 INR resulting in a −13.69% surprise. The estimated earnings for the next quarter are 24.30 INR per share. See more details about PI Industries Limited earnings.
PI Industries Limited revenue for the last quarter amounts to 19.00 B INR, despite the estimated figure of 22.61 B INR. In the next quarter, revenue is expected to reach 19.18 B INR.
PIIND net income for the last quarter is 4.00 B INR, while the quarter before that showed 3.31 B INR of net income which accounts for 21.03% change. Track more PI Industries Limited financial stats to get the full picture.
PI Industries Limited dividend yield was 0.47% in 2024, and payout ratio reached 14.62%. The year before the numbers were 0.39% and 13.53% correspondingly. See high-dividend stocks and find more opportunities for your portfolio.
As of Nov 10, 2025, the company has 6.34 K employees. See our rating of the largest employees — is PI Industries Limited on this list?
EBITDA measures a company's operating performance, its growth signifies an improvement in the efficiency of a company. PI Industries Limited EBITDA is 21.62 B INR, and current EBITDA margin is 27.55%. See more stats in PI Industries Limited financial statements.
Like other stocks, PIIND shares are traded on stock exchanges, e.g. Nasdaq, Nyse, Euronext, and the easiest way to buy them is through an online stock broker. To do this, you need to open an account and follow a broker's procedures, then start trading. You can trade PI Industries Limited stock right from TradingView charts — choose your broker and connect to your account.
Investing in stocks requires a comprehensive research: you should carefully study all the available data, e.g. company's financials, related news, and its technical analysis. So PI Industries Limited technincal analysis shows the buy rating today, and its 1 week rating is neutral. Since market conditions are prone to changes, it's worth looking a bit further into the future — according to the 1 month rating PI Industries Limited stock shows the buy signal. See more of PI Industries Limited technicals for a more comprehensive analysis.
If you're still not sure, try looking for inspiration in our curated watchlists.
If you're still not sure, try looking for inspiration in our curated watchlists.