POONAWALLA 1 Day Time Frame 📌 Latest price & context
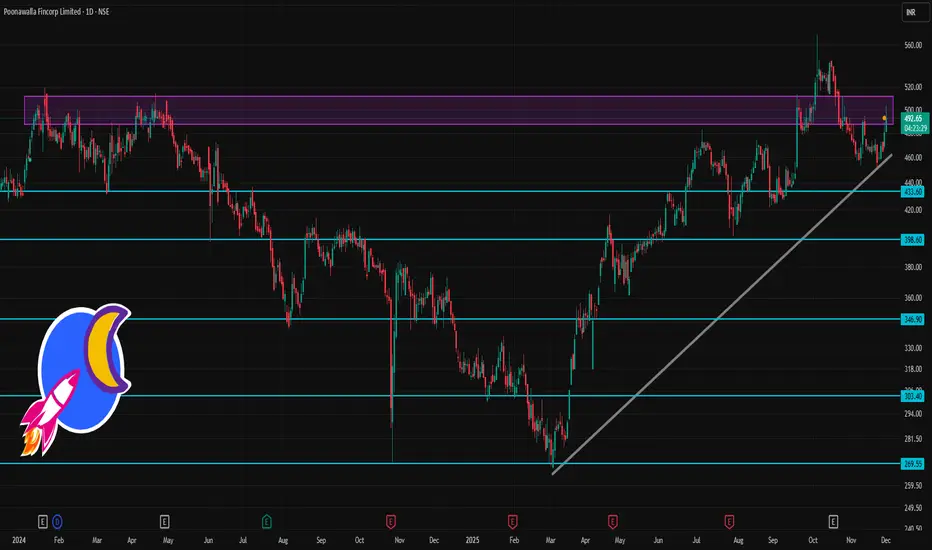
On one of the latest snapshots, the share price was ~ ₹ 492.65 (as per a public chart)
The stock remains among relatively volatile mid-cap / NBFC counters, with a fairly high beta (i.e. sensitivity to market swings).
✅ Technical Momentum & Risk Profile
Technical sources currently signal a “bullish / buy-leaning” bias based on moving averages (from short-term to long-term) for Poonawalla.
But high volatility & elevated beta mean risk — sharp swings are possible in either direction depending on market sentiment, NBFC-sector news, and macro cues.
⚠️ What to watch out for
The pivot-based levels assume relatively normal volatility — big sector-wide moves, news, or NBFC-specific developments can render them less reliable.
As an NBFC / mid-cap, the stock remains sensitive to interest-rate outlook, credit-sector sentiment, and macroeconomic conditions — not just its own chart.
The “buy bias” from moving averages doesn’t guarantee a smooth upward path — you should watch volume, daily chart pattern, and broader market context.
Market insights
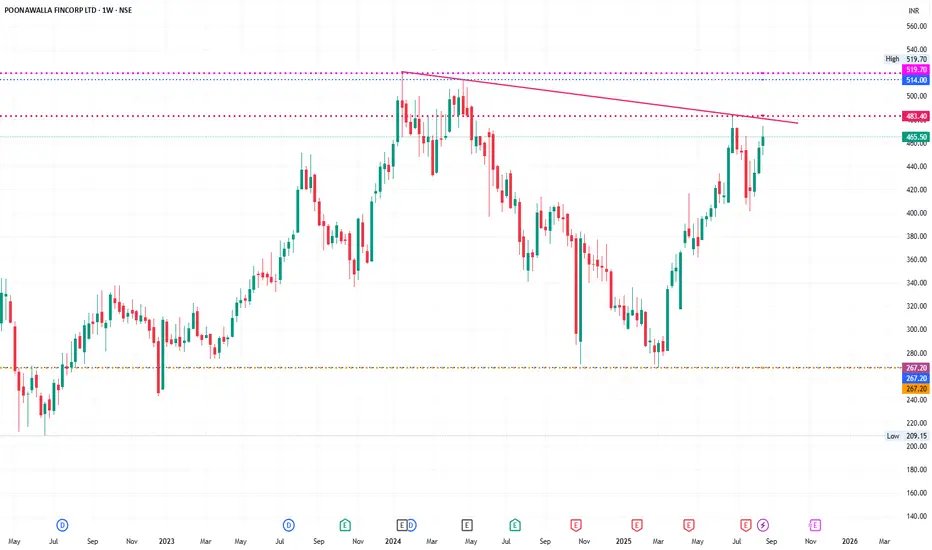
Descending Triangle / Falling Trendline Resistance step-by-step technical analysis of Poonawalla Fincorp Ltd (Weekly Chart) the same way:
🔎 1. Chart Pattern
The stock is currently forming a Descending Triangle / Falling Trendline Resistance.
Price is approaching the trendline resistance (~₹480–485).
Breakout above ₹485–490 will confirm trend reversal.
If rejected, it may retrace back to lower supports.
🔎 2. Support & Resistance
Immediate Resistance: ₹483–490 (trendline + horizontal supply).
Next Resistance Levels: ₹514 → ₹520 (previous swing high).
Major Resistance: ₹550.
Immediate Support: ₹440 → ₹420 (recent consolidation).
Major Support Zone: ₹365 → ₹340.
Long-term Support: ₹267 (very strong base).
🔎 3. Candlestick / Price Action
The last few weekly candles show strong bullish momentum, higher highs, and higher lows.
But approaching a major supply zone (~₹480–490) → possible profit booking.
A weekly close above ₹490 with volume will confirm fresh breakout rally.
🔎 4. Indicators Perspective
RSI: Likely near 65–68 → bullish momentum but nearing overbought zone.
MACD: Positive crossover with rising histogram → bullish confirmation.
Volume: Increasing on recent up-move → accumulation happening.
Moving Averages:
Price trading above 20W & 50W EMAs → trend bullish.
If it sustains above ₹485, 200W EMA breakout likely confirms long-term uptrend.
🔎 5. Trend Outlook
Primary Trend (1–2 years): Bullish, provided stock sustains above ₹490.
Intermediate Trend (2–6 months): Neutral to bullish, watch for breakout.
Short Term (1–4 weeks): Testing resistance zone ₹480–490, may consolidate.
📌 Conclusion (Expert View)
✅ Stock is in strong uptrend but at a crucial resistance (₹483–490).
✅ Breakout above ₹490 can lead to targets ₹514 → ₹520 → ₹550.
✅ If rejected, stock can pull back to ₹440 → ₹420 zone (buying zone).
⚠️ Risk-Reward currently not very favorable until clear breakout.
👉 Strategy:
Traders: Wait for weekly close above ₹490 to enter fresh longs.
If already holding, book partial profit near ₹480–490, re-enter above ₹490 breakout.
Investors: Can accumulate on dips to ₹420–440 with SL ₹365
this is only for educational purpose not for suggestion
The sky is the limit [POONAWALLA Fincorp] 🏦 About Poonawalla Fincorp (POONAWALLA)
Business / Fundamentals Summary
Poonawalla Fincorp (formerly Magma Fincorp) is an NBFC (non-banking finance company) operating in consumer & MSME lending across India.
The promoter is Rising Sun Holdings, an entity of Adar Poonawalla.
Recently, the promoter infused ₹1,500 crore via preferential allotment, strengthening the capital base.
The stock has relatively weak profitability metrics: ROE is negative (≈ –1.2% in latest) and ROCE is modest (≈ 5-6 %)
Price / Book ratio is elevated — around 4–5× depending on source.
The company has seen healthy growth in assets and revenue in recent quarters/years.
Strengths / Risks (Fundamental)
Strengths Risks / Weaknesses
Fresh promoter capital infusion adds cushion and confidence Profitability is weak / negative EPS in TTM for some quarters
Growth potential in consumer / MSME lending in India High valuation multiples vs fundamentals (high P/B)
Strong brand backing due to connection with Poonawalla / Adar Poonawalla Interest costs / credit risk (NBFCs are vulnerable to credit cycles)
Rising AUM and loan book expansion Execution / asset quality risk
From a “story” or narrative angle, the capital infusion and backing by a well-known promoter are positives that can drive market confidence, but the real financials must improve (profit, margins, asset quality) for this to be sustainable.
---
📈 Technical / Price Action Idea
Below is a sample technical sketch you can adapt to your chart (with actual levels from your preferred timeframe).
Observations & Possible Setups
1. Trend & Momentum
The stock has seen strong upward moves recently, capturing attention and hitting fresh highs.
Volume spikes on up days suggest institutional / interest support.
2. Support / Resistance Zones
Support Zone: Around previous consolidation or pullback levels. For example, one may look for support around ₹480–₹500 (or lower depending on your timeframe).
Resistance / Target Zone: The next supply zones / swing highs. If the stock breaks above the recent high, your target could be near ₹550–₹580 (your own risk / reward judgment).
Use pivot levels, moving averages (e.g. 50 DMA, 200 DMA) to guide dynamic support/resistance.
3. Breakout / Pullback Setup
If it consolidates near support and holds, this could be a long on pullback opportunity with tight stop loss below support.
Alternatively, wait for a breakout above resistance with volume confirmation to enter long.
Risk management is key: NBFCs can be volatile, so keep stop-loss tight relative to your entry.
4. Indicators / Confirmation
RSI / Momentum: Look for RSI bouncing from oversold or crossing above midline.
MACD: A bullish crossover or positive histogram expansion might confirm upward bias.
Volume: Confirm with rising volume in direction of breakout.
Bollinger Bands / VWAP: Helps identify mean reversion / trend strength zones.
5. Watch out for Reversal Signals
If stock fails to hold support or shows bearish divergence (price higher, RSI lower), that may warn of reversal or correction.

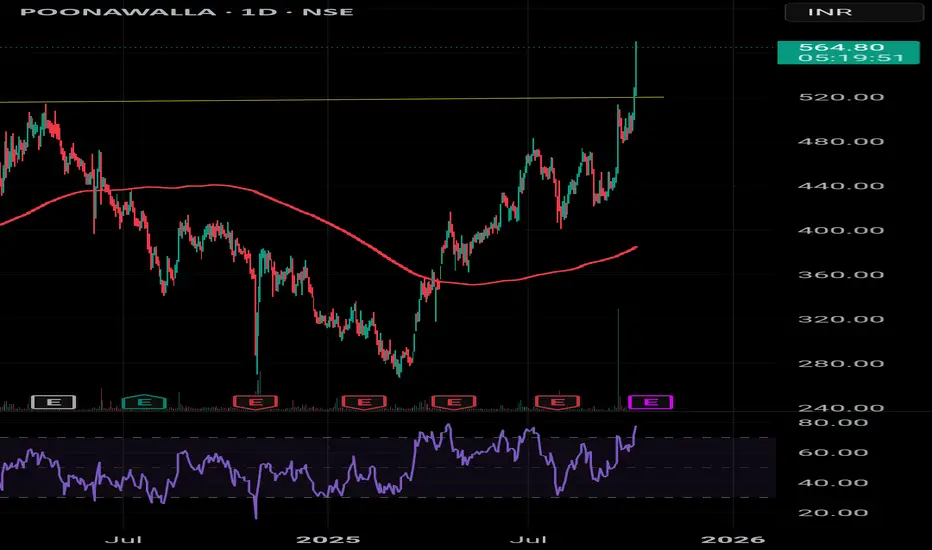
Poonawalla Fincorp (POONAWALLA)Poonawalla Fincorp Limited (NSE: POONAWALLA), a non-banking financial company (NBFC) under the Cyrus Poonawalla Group, focuses on consumer and MSME lending, including personal loans, vehicle finance, and supply chain financing. As of October 7, 2025, the stock trades around ₹565, up ~8% in the last session and ~76% year-to-date (YTD), significantly outperforming the Sensex's ~4% gain. This momentum stems from robust operational growth, promoter confidence, and technical strength. Below, I'll outline key reasons to consider it, based on recent financials, market analysis, and sentiment. Note: This is not financial advice—always conduct your own due diligence, as NBFC stocks can be volatile due to interest rate sensitivity and credit risks.
Explosive Growth: AUM up 67.7% YoY to ₹47,625 Cr, with 35-40% growth expected in FY26.
Promoter Confidence: ₹1,500 Cr infusion, promoter holding at 62.5%.
Strong Financials: ₹6,200 Cr liquidity, 11% NII growth, low credit costs.
Bullish Technicals: Breakout above ₹480, targets ₹620-₹650, RSI at 73.
Market Edge: Retail credit boom, AI-driven lending, positive X sentiment.
Risks: Profit dip (one-off), rate sensitivity, high valuation. Watch Q2 results (Oct 17).
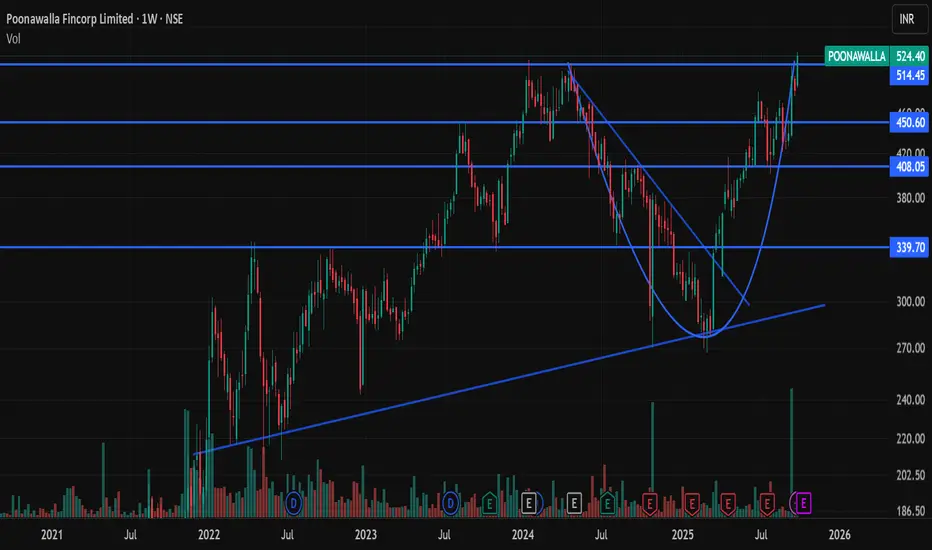
Breakout with Rising Volume | Retest-and-Go SetupPrice has completed a multi-quarter rounding bottom/cup and has broken out above the ₹514–515 supply zone, printing new highs. Breakout comes with expanding weekly volumes, and prior resistances at ₹450 and ₹408 now act as support. A long-term rising trendline from 2022 remains intact.
Trade Plan (swing):
Entry 1 (retest): ₹515–505 zone if price pulls back and holds.
Entry 2 (strength): Add above ₹535 weekly close.
Stops: Conservative SL ₹495 (weekly close basis). Wider swing SL ₹480; structure invalidation on a sustained close below ₹450.
This is an educational view, not financial advice. Do your own research and manage risk.
POONAWALLA FINCORP LTD ANALYSISWhat happens when FIIs, DIIs, Mutual Funds, and even the company's own Promoters all start buying up shares of the same stock over the last year?
You get a potential explosive setup.
This week, we're analyzing a stock where the "smart money" has left a trail of footprints so large, they're impossible to ignore.
The Analysis- Poonawalla Fincorp is showing a rare convergence of technical strength and institutional accumulation. After a two-year period of quiet consolidation, this stock is showing clear signs of waking up.
Here is the professional thesis for this potential market leader.
1. The Technical Breakout: A Coiled Spring Unleashed
After a historic 3700%+ run from its COVID lows, the stock entered a necessary two-year period of price and time correction. This "hibernation" allowed it to build a massive consolidation base.
Now, it is breaking out of that base and challenging a resistance level that has held it back for nearly 1.5 years. A move to a new All-Time High is now in sight. This is a classic sign of a transition from consolidation to a new potential uptrend.
2. The Confirmation Signals: Strength & Volume
Two key factors confirm the strength of this breakout:
💠Relative Strength: In a volatile market, Poonawalla has been a clear outperformer. It held its ground firmly while weaker stocks faltered, proving it is a market leader, not a laggard.
💠Historic Volume Surge: Last week, the stock registered its highest weekly volume in history. This is not retail activity. This is the unmistakable footprint of large institutions accumulating shares, providing immense fuel for the potential move higher.
The Game Plan
This analysis is for educational purposes. Here is how a professional might structure a trade plan around this thesis:
Stock: Poonawalla Fincorp Ltd
Entry: Near current price of ₹500.25
Stop-Loss: ₹425.20 (Placed below a key structural pivot to invalidate the breakout thesis if hit)
Initial Target: 35-40% profit zone, with a plan to trail positions thereafter to capture a larger trend.
Key Concern: There is a minor resistance 3.5% above the current price. A decisive break above this level would add further confirmation and could lead to a rapid acceleration.
Disclaimer: This is not investment advice. It is a technical and fundamental analysis for educational purposes. Always manage your risk.

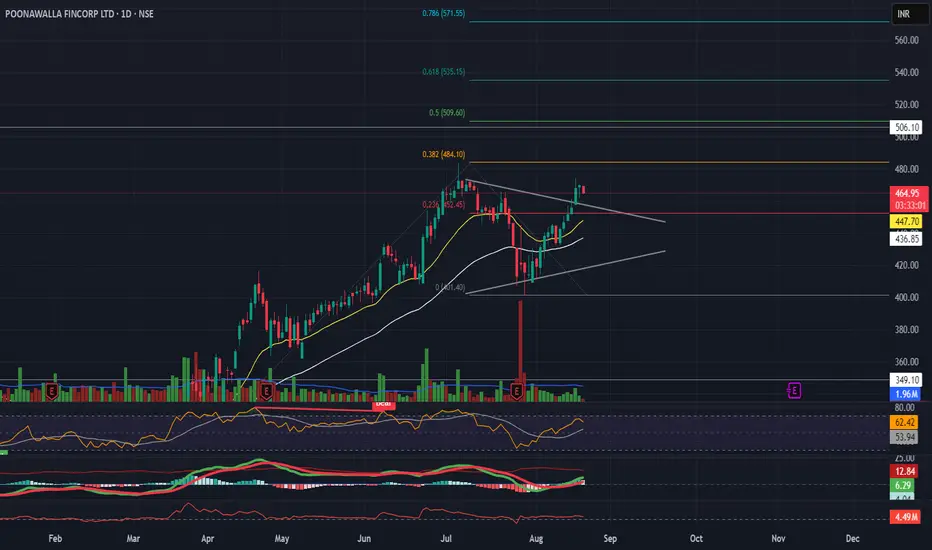
Poonawalla Fincorp Ltd (POONAWALLA) – Bullish Breakout SetupPrice Action
Closing Price (Sep 19, 2025): ₹502.10
Recent Performance: The stock surged approximately 12% on September 18, 2025, reaching a new 52-week high of ₹500 on the BSE, following the completion of a ₹1,500 crore preferential share allotment to its promoter entity, Rising Sun Holdings Private Limited.
The Economic Times
Key Levels
Resistance Zones: ₹510–₹520 (recent highs), ₹530 (psychological level)
Support Zones: ₹490–₹495 (recent consolidation), ₹470–₹475 (previous breakout levels)
Upside Targets
T1: ₹520
T2: ₹530
T3: ₹550 (medium-term target)
Invalidation: A sustained drop below ₹470 would weaken the bullish setup.
Indicators & Momentum
RSI (14): 78.75 – Indicates overbought conditions; monitor for potential pullbacks.
MACD: 12.88 – Suggests bullish momentum.
Trading View Bias
Bias: Bullish above ₹495
Short-Term Target: ₹510–₹520
Medium-Term Target: ₹530–₹550
Caution: Close below ₹470 shifts bias to neutral.

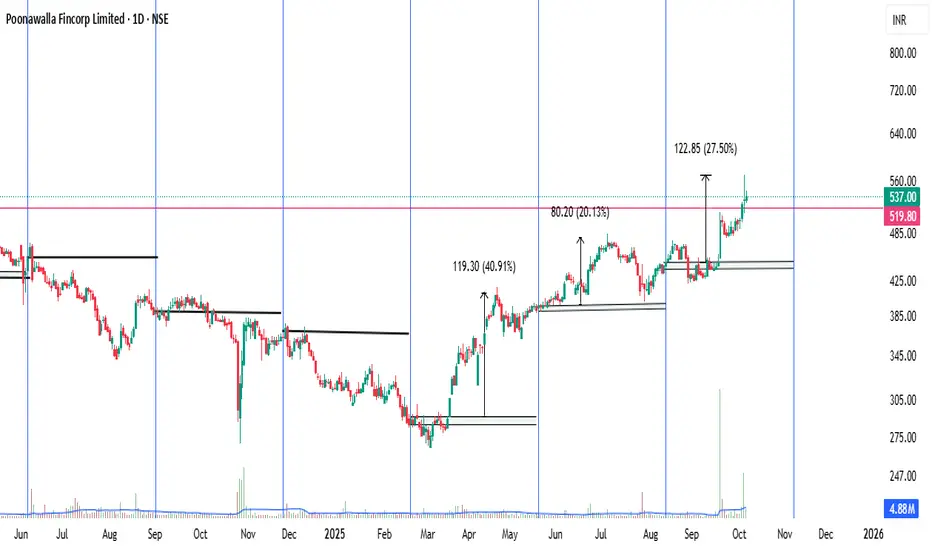
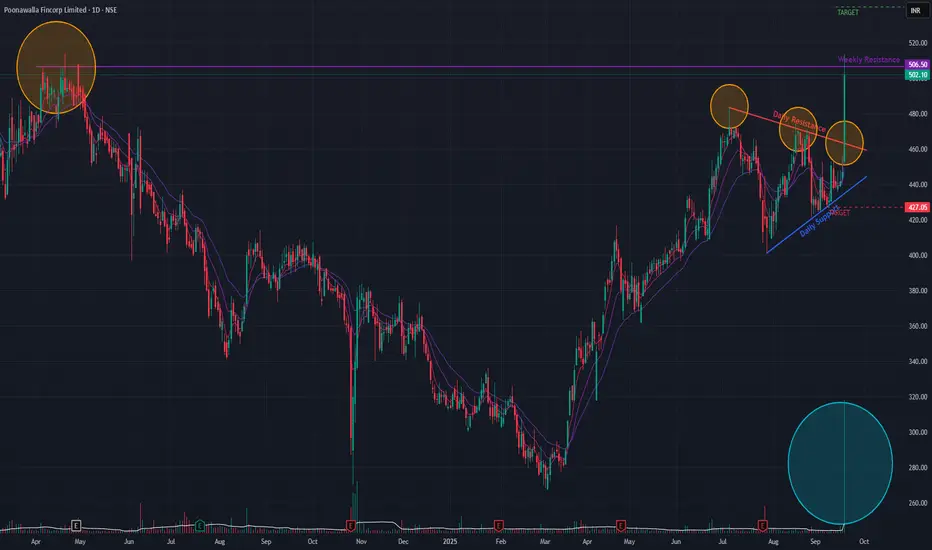
Poonawalla Fincorp (Daily) - Potential ATH ?Poonawalla Fincorp has shown a significant bullish development, decisively breaking out of a Triangle continuation pattern today. This breakout was marked by a substantial 12.30% surge in price , backed by exceptionally high trading volume.
This move signals a potential continuation of the bullish run that began in March 2025, which itself was a reversal of a downtrend initiated by a Double-Top bearish pattern in April 2024.
Bullish Confirmation Signals 👍
The positive outlook is supported by several key indicators:
- Breakout Volume: The price surge was accompanied by a massive spike in volume , indicating strong conviction and participation from buyers.
- Momentum: Short-term Exponential Moving Averages (EMAs) have formed a positive crossover , confirming the renewed bullish momentum in the immediate term.
Immediate Hurdle Ahead 🚧
Despite the strong breakout, the stock is now trading at a crucial long-term resistance level . Overcoming this barrier is essential for the upward trend to continue.
Future Outlook and Scenarios
- Bullish Case 📈: If the upward momentum is sustained and the stock successfully breaks through the current long-term resistance, it could clear the path to test its all-time high . An initial price target in this scenario would be the ₹539 level.
- Bearish Case 📉: Conversely, if the stock fails to breach this resistance, the momentum could fade, potentially leading to a price correction towards the ₹427 support level.
Watchout for the price-action in the next few sessions !!
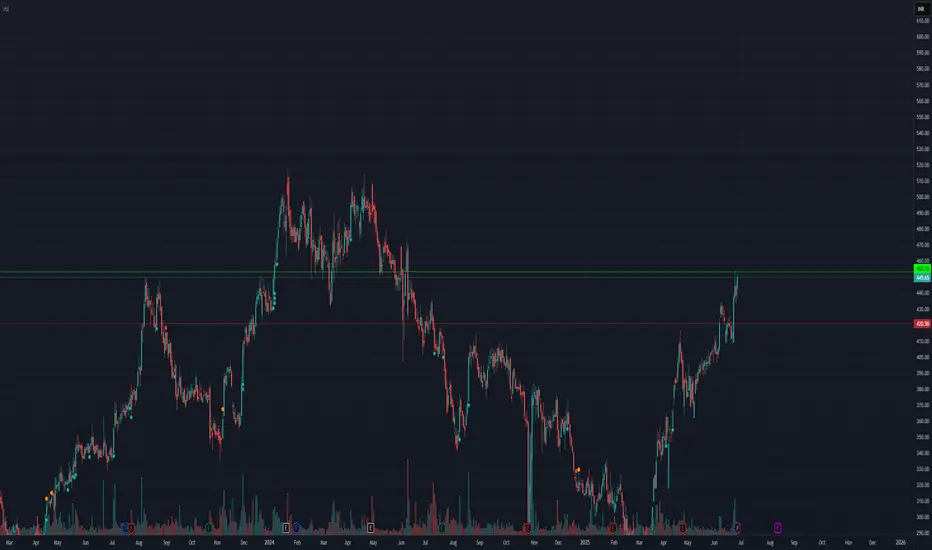
Poonawalla Fincorp Forming Inverse Head & ShoulderThe stock has been in forming an inverse head and shoulder pattern since past 1.5 years and lately has broken out with some good volumes
462-469 Levels were pretty crucial but were shattered in no time
The stock has been bought consistently by the big hands.
It can rally more than 40% in no time hitting the 704 levels.
The fundamentals are however bit concerning, the profits of the company declined this year however some if good momentum prevails can rally decently

Poonawalla Fincorp: Is It a Buy for Swing Trading Right Now?When it comes to swing trading, momentum and timing matter as much as fundamentals. One stock that has caught a lot of attention recently is Poonawalla Fincorp. With strong AUM growth, fresh promoter funding, and a breakout move on the charts, traders are asking: Is this the right time to ride the trend? Let’s break it down.
🚀 Fundamental Snapshot
Assets Under Management (AUM) have shot up to ~₹41,000+ crore in Q1 FY26 — that’s over 53% YoY growth.
Asset quality is under control with GNPA ~1.8% and NNPA below 1%.
Promoter infusion of ₹1,500 crore has strengthened the balance sheet, giving it a big growth cushion.
Secured lending focus (57% of the book) reduces risk compared to a purely unsecured book.
On paper, Poonawalla looks like a strong growth NBFC that’s expanding smartly into retail segments while keeping risks in check.
⚠️ The Risks You Can’t Ignore
Profitability swings: Despite AUM growth, quarterly profit numbers have been volatile. In some periods, net profit dipped sharply.
Rich valuation: With a Price-to-Book multiple around 3.7–4×, the stock trades at a premium to peers.
Dilution factor: The promoter’s equity infusion, while positive for growth, can weigh on per-share earnings.
Macro sensitivity: As with any NBFC, rising interest rates or credit defaults could hit margins fast.
So while the growth story is intact, the market has already priced in a lot of good news.
📈 Technical Setup
52-week range: ₹267 (low) – ₹483 (high).
The stock recently touched fresh highs after the capital infusion news, showing strong momentum.
Current price action sits closer to resistance, so chasing blindly could be risky.
Trading levels to watch:
Support zone: ₹440–₹460
Resistance zone / target: ₹480–₹500
Stop loss: Below ₹420 for short-term swing positions
📝 Swing Trade View
If you’re looking at Poonawalla Fincorp purely for a swing trade (2–6 weeks horizon):
Bias: Positive, but only with disciplined risk management.
Best entry: On dips near support levels, not at the very top.
Catalyst: Next quarterly earnings or further updates on loan book quality could fuel another breakout.
✅ Final Word
Poonawalla Fincorp is showing a blend of strong growth fundamentals and bullish momentum. For swing traders, that’s an attractive combo. But with valuations stretched and profitability inconsistent, the stock isn’t without risks.
👉 If you plan to trade it, treat it as a momentum play with strict stop-losses, not a blind long-term hold.
“Consider entering fresh positions if the stock sustains above ₹516, treating it as a breakout level. Traders can also look to accumulate on healthy retracements. Upside targets are set at ₹616, ₹800, and ₹1,000, while a protective stop-loss should be placed near ₹400.”

Expecting Short Selling - Poonawalla Financeexpecting heavy selling
in my view entry at 465
target - 265
stop loss - 525

Poonawalla Fincorp showing a symmetrical triangle breakout:
Setup: Clear breakout above trendline resistance on daily chart.
Indicators:
RSI at 62 → momentum strong, near overbought but not overheated.
MACD bullish crossover with positive histogram.
EMAs: 20 & 50 EMA slope positive; price sustaining above both.
Levels:
Stoploss: ₹445
Targets: ₹509 immediate, then ₹535
👉 Outlook: Strong bullish bias. Sustaining above ₹473 opens path towards ₹500–506 zone. Support at ₹445.
Resistance breakout in POONAWALAEntry: Above 455
SL: 420
Target: 510
Nearly 10% FII holding and rising; promoter also adding.
Poonawalla Fincorp | Probable Bullish Flag Breakout Candidate📊 Technical Analysis Overview:
Poonawalla Fincorp is showing strong bullish momentum and is currently a probable flag breakout candidate. The stock has crossed the 200-day EMA with high volume, indicating strong institutional participation. Additionally, RSI is above 70, confirming bullish strength.
📌 Trade Setup & Key Levels
✅ Buy Entry: ₹357
🚨 Stop Loss: ₹333
🎯 Target Levels:
🔹 Target 1: ₹399.10
🔹 Target 2: ₹414.20
🔹 Target 3: ₹429.85
🔹 Target 4: ₹570.50
🔹 Target 5: ₹584.55
📈 Technical Observations
🔹 Flag Breakout Formation: The stock is attempting a breakout from a bullish flag pattern, which often leads to strong uptrends.
🔹 Volume Confirmation: A surge in volume alongside the breakout increases the probability of sustained upside.
🔹 200 DEMA Crossover: The price has successfully crossed the 200-day EMA, a strong bullish signal.
🔹 RSI Above 70: Indicates strong momentum, though a short-term pullback cannot be ruled out.
⚠️ Risk Management & Final Thoughts
Always use proper risk management to protect capital. The stop loss at ₹333 ensures a controlled downside, while the upside targets provide a strong risk-reward ratio.
📢 Watch for Retest: If the price retests the ₹357 level after the breakout and holds, it could provide another buying opportunity.
📊 What do you think? Will Poonawalla Fincorp continue its rally? Share your thoughts in the comments! 👇

POONAWALLA - PRZ at 380-390CMP: 364
5th wave target and rounding bottom breakout pattern target both pointing towards 380-390
Almost nearing the 5th wave target..
Profit booking could take place between 380-390 zones..
No point in chasing it at this price

POONAWALLA📊 Volume Analysis
Recent weeks show a notable rise in volume, especially during bullish candles. This confirms buying interest behind the price action.
Compared to the low-volume consolidation phase (late 2024), this uptick in volume supports the validity of the current uptrend.Volume spike 3–4 weeks ago suggests accumulation or strong institutional interest.
💨 Momentum (RSI) Analysis
The RSI is currently at 61.52, moving upwards and entering the bullish zone. It has crossed above the 50-level decisively, which is a positive sign of momentum shift from bearish to bullish. RSI still has room before becoming overbought (>70), indicating potential for further upside.
📈 Trend Analysis (Price Action)
The price has formed a higher high and higher low on the weekly chart — a classic bullish trend structure. It has moved above recent consolidation resistance (~350–360 zone), turning previous supply into demand. Price is currently trading above the midline (20-period SMA) of the Bollinger Bands, signaling strength in trend.
🌪️ Volatility Analysis (Bollinger Bands)
The Bollinger Bands are expanding, indicating increased volatility and often preceding strong price moves. Price is hugging the upper band, which is bullish but can also suggest temporary overextension — potential for a small pullback or consolidation before further uptrend.
The breakout from the lower band to upper band in recent weeks is significant, showing a shift in volatility regime from contraction to expansion.

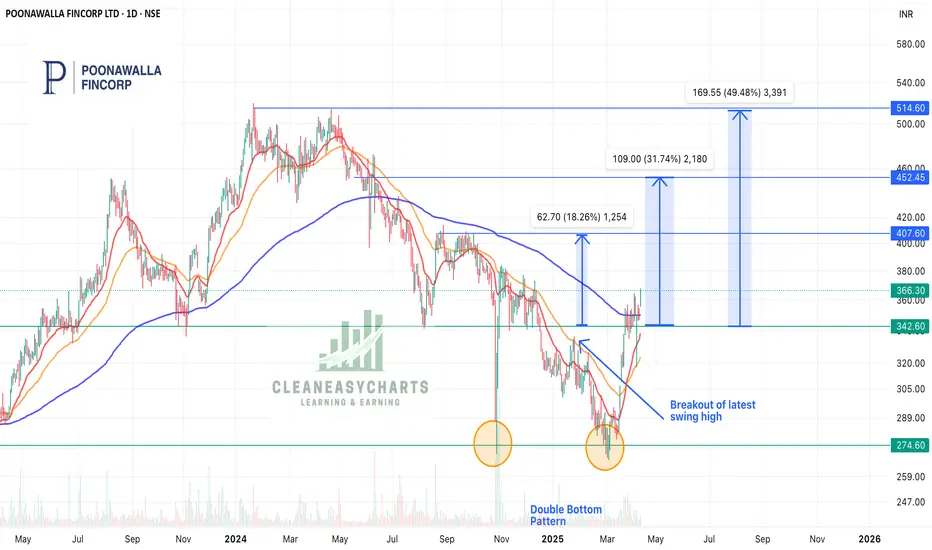
Poonawala Fincorp - Double Bottom PatternPoonawala Fincorp is a NBFC and is making a double bottom pattern. This stock is heading to ATH again. Other factors:
1. Sign of bullish momentum:
- Double Bottom pattern
- Breakout of recent high
- 20 EMA ready to cross 200EMA
2. 5 year growth plan
- Assets worth $17billion
- Raising 10000 cr funding
- Increasing offices from 100 to 400
- Already expanded to education loan, personal loan and commercial vehicle loans
Post rate cut by RBI, NFC sector is ready to roar!!
Keep this stock in your radar!!
Keep following @Cleaneasycharts as we provide Right Stocks at Right Time at Right Price.
Cheers!!
Poonawalla Fincorp LtdDate 06.04.2025
Poonawalla Fincorp
Timeframe : Weekly
About
A non-deposit taking NBFC registered with RBI. It is engaged in providing consumer and MSME financing, as well as General Insurance services.
Product Portfolio
1 Pre-Owned Car Finance
2 Personal Loans
3 Business Loans
4 Loan against property
5 Professional Loans
Key Ratios
1 Gross NPA: 2.1% in Q2 FY25 vs 3.29% in FY22
2 Net NPA: 0.33% in Q2 FY25 vs 1.30% in FY22
3 Capital Adequacy Ratio: 29.22% in Q2 FY25 vs 49.1% in FY22
4 Provision Coverage Ratio: 84.47% in Q2 FY25 vs 58.9% in FY22
AUM Mix:
1 MSME: 33%
2 Personal and Consumer: 28%
3 LAP: 19%
4 POC: 14%
5 Discontinued: 3%
6 Others: 2%
Disbursements
The company’s total disbursements have grown from Rs. 7,524 Cr in FY22 to Rs. 33,289 Cr in FY24
Borrowing Mix:
1 Term Loan: 47%
2 Cash Credit / Working Capital Demand Loan: 22%
3 Commercial Papers: 21%
4 Non-Convertible Debentures: 8%
5 Others: 2%
High Provisions
The Company has made its Highest ever Provisions of 666 Crs in Q2FY25
Stock PE 161
ROCE 10%
ROE 14%
Weakness
1 Stock is trading at 3.41 times its book value
2 Company has low interest coverage ratio.
3 Company has a low return on equity of 9.87% over last 3 years.
4 Company might be capitalizing the interest cost
5 Promoter holding has decreased over last 3 years: -5.89%
Strengths
1 Company is expected to give good quarter
2 Company has delivered good profit growth of 28.2% CAGR over last 5 years
Technical :
Formed deep crab pattern based on harmonics, can touch point B at 436
Regards,
Ankur

POONAWALLA Analysis!On this chart, there are special lines called "Fibonacci levels," which help guess where the price might stop or change direction.
Here's the easy part:
Fibonacci Levels: Think of these as road signs on the chart. They show where the price might find support (like a safety net) or resistance (like a ceiling).
Blue Arrow: This arrow suggests that the price might go up.
Price Increase Note: The chart says that the price could increase around 20%.
feel free to ask! 😊

POONAWALLA FINCORP LIMITEDthis chart is very crusial support zone good rsi strength break resistance trandline then entry point clear view cmp 316 entry point above 338 stop loss 315 targate 356 , 372 ,408 431 , 510

Education purpose only - PoonawalaStock is a crucial Trendline support
If is sustains here and crosses 315...
Than it should travel to W20EMA 345
Lets see how hypothesis will play..

POONAWALLAA!Fibonacci levels, which help guess where the price might stop or change direction.
Here's the easy part:
Fibonacci Levels: Think of these as road signs on the chart. They show where the price might find support (like a safety net) or resistance (like a ceiling).
Blue Arrow: This arrow suggests that the price might go up.
Price Increase Note: The chart says that the price could increase.
feel free to ask! 😊
