Ratnamani Metals & Tubes Ltd.
No trades
Next report date
—
Report period
—
EPS estimate
—
Revenue estimate
—
86.55 INR
5.44 B INR
51.86 B INR
21.05 M
About Ratnamani Metals & Tubes Ltd.
Sector
Industry
CEO
Manoj Prakash Sanghvi
Website
Headquarters
Ahmedabad
Founded
1983
IPO date
Mar 9, 1993
Identifiers
2
ISIN INE703B01027
Ratnamani Metals & Tubes Ltd. is a holding company, which engages in the manufacturing of tube and tube fittings of basic iron and steel. It operates through the following segments: Steel Tubes and Pipes, Bearing Rings, and Pipe Spools and Auxiliary Support Systems. The company was founded by Prakash Mishrimal Sanghvi and Jayantilal Mistrimal Sanghvi on September 15, 1983 and is headquartered in Ahmedabad, India.
Related stocks
RATNAMANIMetal stocks are in bullish. this tube & metal stock is going to start it's second phase of run after resting a long time. all moving averages are compressed and price action is showing buy signal. targets are marked on chart.

Stocks To WatchWe have attached the chart here for highly potential upward rally stock People and smart money showing their interest in the stock and as a result we have noticed high delivery of QTY In recent days but still do not buy until it break the trendline resistance as well as immediate horizontal resistan

Positional or Longterm opportunity in RatnamaniGo Long @ 2915.1 for Targets of 3110.2, 3305.3, and 3500.4 with SL 2720
Reasons to go Long :
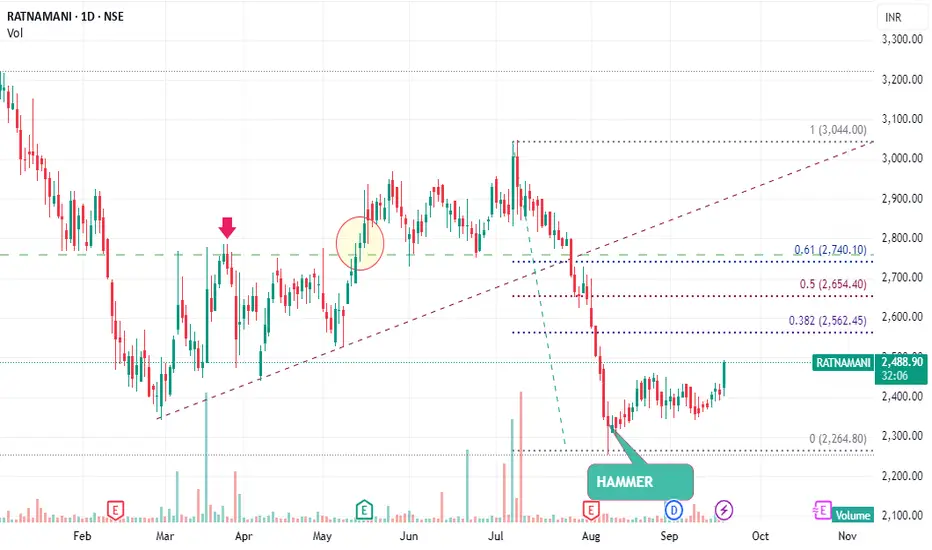
1. On a Weekly timeframe if we draw the Fibonacci retracement tool from the recent swing low (point A) to the recent swing high (point B) then we see stock took support from the 0.382 Fibonacci level.
2.

Breakout in Ratnamani Metals and Tubes Ltd...Chart is self explanatory. Levels of breakout, possible up-moves (where stock may find resistances) and support (close below which, setup will be invalidated) are clearly defined.
Disclaimer: This is for demonstration and educational purpose only. This is not buying or selling recommendations. I am

Ratnamani Metals and Tubes Ltd - Long Setup, Move is ON...#RATNAMANI trading above Resistance of 3167
Next Resistance is at 4803
Support is at 2131
Here is previous chart:
Chart is self explanatory. Levels of breakout, possible up-moves (where stock may find resistances) and support (close below which, setup will be invalidated) are clearly defined.

#RATNAMANI #NSE - BULLISH FLAG PATTERNRATNAMANI METALS AND TUBES LTD
Bullish Flag Pattern in a 60 min time frame.
Positive quarterly results.
Ratnamani Metals & Tubes Ltd.'s Revenue was higher than average estimate 2 times in past 3
EPS is expected to grow by 17.7% in FY24.
FII/FPI have increased holdings from 12.79% to 12.87% in Sep 2

Catch it if u can.........Chart is self explanatory
Already broken out with huge volume candle
Volume on chart shows demand
Already high in sky meaning no supply or resistance zone above
Don't just blind buy..... This ain't no tip......Buy at ur own risk
Comment down below ur views and lemme know what u think abt my rev

Trade-3/100-RATNAM-R:R Experiment-Buy3rd trade in the series
Buying RATNAMANI in hourly POSITIONAL trade

#Ratnamanimetals cash : Looks good above 1930.10#Ratnamani metals -Positional call
29.08.2022
Stock is in uptrend and given a nice Ascending traingle breakout. chart shows the rising channel as price making higher lows and making continues resistance and closed above the resistance zone.
If high is crossed with volumes it will be sign of superb

See all ideas
Summarizing what the indicators are suggesting.
Neutral
SellBuy
Strong sellStrong buy
Strong sellSellNeutralBuyStrong buy
Neutral
SellBuy
Strong sellStrong buy
Strong sellSellNeutralBuyStrong buy
Neutral
SellBuy
Strong sellStrong buy
Strong sellSellNeutralBuyStrong buy
An aggregate view of professional's ratings.
Neutral
SellBuy
Strong sellStrong buy
Strong sellSellNeutralBuyStrong buy
Neutral
SellBuy
Strong sellStrong buy
Strong sellSellNeutralBuyStrong buy
Neutral
SellBuy
Strong sellStrong buy
Strong sellSellNeutralBuyStrong buy
Displays a symbol's price movements over previous years to identify recurring trends.
Frequently Asked Questions
The current price of RATNAMANI is 2,032.20 INR — it has decreased by −1.94% in the past 24 hours. Watch Ratnamani Metals & Tubes Ltd. stock price performance more closely on the chart.
Depending on the exchange, the stock ticker may vary. For instance, on NSE exchange Ratnamani Metals & Tubes Ltd. stocks are traded under the ticker RATNAMANI.
RATNAMANI stock has fallen by −2.30% compared to the previous week, the month change is a −11.96% fall, over the last year Ratnamani Metals & Tubes Ltd. has showed a −28.64% decrease.
We've gathered analysts' opinions on Ratnamani Metals & Tubes Ltd. future price: according to them, RATNAMANI price has a max estimate of 3,420.00 INR and a min estimate of 2,560.00 INR. Watch RATNAMANI chart and read a more detailed Ratnamani Metals & Tubes Ltd. stock forecast: see what analysts think of Ratnamani Metals & Tubes Ltd. and suggest that you do with its stocks.
RATNAMANI reached its all-time high on Sep 13, 2024 with the price of 3,978.50 INR, and its all-time low was 21.05 INR and was reached on Mar 5, 2009. View more price dynamics on RATNAMANI chart.
See other stocks reaching their highest and lowest prices.
See other stocks reaching their highest and lowest prices.
RATNAMANI stock is 3.22% volatile and has beta coefficient of 1.15. Track Ratnamani Metals & Tubes Ltd. stock price on the chart and check out the list of the most volatile stocks — is Ratnamani Metals & Tubes Ltd. there?
Today Ratnamani Metals & Tubes Ltd. has the market capitalization of 144.71 B, it has increased by 5.14% over the last week.
Yes, you can track Ratnamani Metals & Tubes Ltd. financials in yearly and quarterly reports right on TradingView.
Ratnamani Metals & Tubes Ltd. is going to release the next earnings report on Feb 6, 2026. Keep track of upcoming events with our Earnings Calendar.
RATNAMANI earnings for the last quarter are 20.85 INR per share, whereas the estimation was 19.10 INR resulting in a 9.16% surprise. The estimated earnings for the next quarter are 19.70 INR per share. See more details about Ratnamani Metals & Tubes Ltd. earnings.
Ratnamani Metals & Tubes Ltd. revenue for the last quarter amounts to 11.92 B INR, despite the estimated figure of 10.43 B INR. In the next quarter, revenue is expected to reach 11.68 B INR.
RATNAMANI net income for the last quarter is 1.36 B INR, while the quarter before that showed 1.32 B INR of net income which accounts for 3.34% change. Track more Ratnamani Metals & Tubes Ltd. financial stats to get the full picture.
Yes, RATNAMANI dividends are paid annually. The last dividend per share was 14.00 INR. As of today, Dividend Yield (TTM)% is 0.68%. Tracking Ratnamani Metals & Tubes Ltd. dividends might help you take more informed decisions.
Ratnamani Metals & Tubes Ltd. dividend yield was 0.54% in 2024, and payout ratio reached 18.04%. The year before the numbers were 0.50% and 15.76% correspondingly. See high-dividend stocks and find more opportunities for your portfolio.
As of Feb 5, 2026, the company has 3.16 K employees. See our rating of the largest employees — is Ratnamani Metals & Tubes Ltd. on this list?
EBITDA measures a company's operating performance, its growth signifies an improvement in the efficiency of a company. Ratnamani Metals & Tubes Ltd. EBITDA is 9.05 B INR, and current EBITDA margin is 16.14%. See more stats in Ratnamani Metals & Tubes Ltd. financial statements.
Like other stocks, RATNAMANI shares are traded on stock exchanges, e.g. Nasdaq, Nyse, Euronext, and the easiest way to buy them is through an online stock broker. To do this, you need to open an account and follow a broker's procedures, then start trading. You can trade Ratnamani Metals & Tubes Ltd. stock right from TradingView charts — choose your broker and connect to your account.
Investing in stocks requires a comprehensive research: you should carefully study all the available data, e.g. company's financials, related news, and its technical analysis. So Ratnamani Metals & Tubes Ltd. technincal analysis shows the strong sell today, and its 1 week rating is sell. Since market conditions are prone to changes, it's worth looking a bit further into the future — according to the 1 month rating Ratnamani Metals & Tubes Ltd. stock shows the sell signal. See more of Ratnamani Metals & Tubes Ltd. technicals for a more comprehensive analysis.
If you're still not sure, try looking for inspiration in our curated watchlists.
If you're still not sure, try looking for inspiration in our curated watchlists.