RITES Ltd (Monthly Chart – NSE)🔍 Chart Structure & Trend
The stock is in a long-term uptrend since 2020, marked by higher highs and higher lows.
Price action is currently moving within a symmetrical triangle / converging trendline structure:
Rising trendline support from 2022–2025.
Falling trendline resistance from the 2024 peak.
This indicates price consolidation after a strong uptrend, usually a pause before expansion.
🟦 Key Support Zones
₹235–240
Immediate support near the rising trendline.
Price has already respected this zone multiple times (as marked).
₹210–215
Major structural support.
Breakdown below this may weaken the medium-term trend.
₹185–190 (Extreme support)
Valid only if broader market sentiment turns negative.
🔴 Resistance Zones
₹270–280
Near the upper trendline of the triangle.
First hurdle for any upside move.
₹300+
Psychological & historical resistance.
Sustained breakout above this can trigger trend acceleration.
📈 Pattern Interpretation
Symmetrical Triangle after an uptrend → Bullish continuation pattern (probability-based, not guaranteed).
Volume contraction (if confirmed) would further support a breakout setup.
Directional move is expected once price closes decisively outside the triangle on monthly basis.
🧭 Possible Scenarios
Bullish Scenario
Monthly close above ₹280–285
Target zones (positional): ₹320 → ₹360 (time-dependent)
Neutral / Range-bound
Price oscillates between ₹235–280
Best suited for long-term investors, not aggressive traders
Bearish Scenario
Monthly close below ₹210
Trend weakens; deeper correction possible
🧠 Risk Management View
Trend remains constructive as long as rising trendline holds.
No aggressive positions advised inside triangle.
Confirmation > prediction.
⚠️ Disclaimer
This analysis is purely for educational and informational purposes based on technical chart patterns.
It does not constitute investment advice, buy/sell recommendation, or solicitation.
Stock market investments are subject to market risks. Please consult a SEBI-registered investment advisor or do your own research before taking any financial decision.
RITES Ltd.
No trades
Market insights

RITES - Bat 0.8 revThe Bat pattern is a precise harmonic pattern that I discovered in 2001. The Bat pattern is probably the most accurate pattern in the entire Harmonic Trading arsenal. The pattern possesses many distinct elements that define an excellent Potential Reversal Zone (PRZ). The pattern typically represents a deep retest of support or resistance that can frequently be quite sharp. Quick reversals from Bat pattern PRZs are quite common. In fact, valid reversals from Bat patterns frequently possess price action that is quite extreme. The pattern incorporates the powerful 0.886XA retracement, as the defining element in the Potential Reversal Zone (PRZ). The B point retracement must be less than a 0.618, preferably a 0.50 or 0.382 of the XA leg. The most ideal B point alignment is the 50% retracement of the XA leg. The B point is one of the primary ways to differentiate a Bat from a Gartley pattern. If a pattern is forming and the B point aligns at a 0.50 of the XA leg, it is likely to be a Bat. The Bat utilizes a BC projection that is at least 1.618. The BC projection can be as much as 2.618. However, the most ideal BC projections in a Bat pattern are a 1.618 or a 2.0. It is important to note that the BC projection must not be a 1.27, as anything less than a 1.618 BC projection invalidates the structure. Furthermore, the 1.27 BC projections are usually found in Gartley structures. The AB=CD pattern within the Bat distinguishes the structure, as well. This pattern is usually extended and ideally possesses a 1.27AB=CD calculation. However, the equivalent AB=CD pattern serves as a minimum requirement for any Bat to be a valid set-up. It is an incredibly accurate pattern and requires a smaller stop loss.

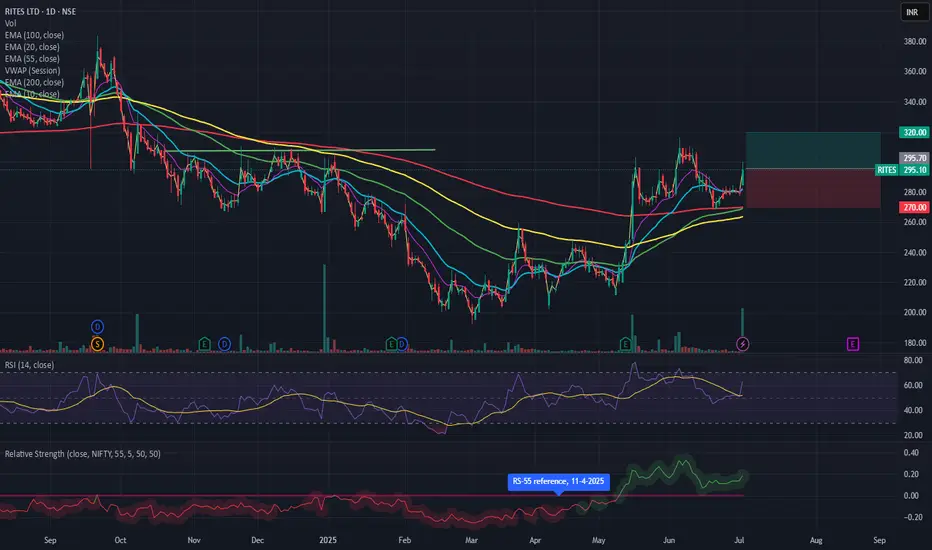
RITES Swing Breakout – Entry, Stop Loss, TargetsRITES has confirmed a clean breakout above the key EMA cluster (10/20/50/100) with strong volume and positive PSU momentum. The stock reclaimed the 200 EMA and closed near the day’s high, indicating strong buying interest.
🔹 Technical Highlights:
✅ Price above all major EMAs (bullish alignment)
✅ Volume spike vs 30-day average
✅ RSI ~63 (momentum healthy, not overbought)
✅ Relative strength outperforming NIFTY
🔹 Trade Plan:
Entry Zone: ₹288–295
Stop Loss: ₹269 (EOD close basis)
Target 1: ₹320
Target 2: ₹345–350
Invalidation: Sustained close below ₹269
This setup offers a favorable risk-reward for a swing trade, supported by strong technicals and sector tailwind.
#SwingTrading #Breakout #RITES #TechnicalAnalysis #PSUStocks
RITES LTD - Bullish Flag & Pole Breakout (Daily T/F)Trade Setup
📌 Stock: RITES LTD ( NSE:RITES )
📌 Trend: Strong Bullish Momentum
📌 Risk-Reward Ratio: 1:3 (Favorable)
🎯 Entry Zone: ₹295.00 (Breakout Confirmation)
🛑 Stop Loss: ₹260.00(Daily Closing Basis) (-12% Risk)
🎯 Target Levels:
₹309.90
₹326.15
₹338.05
₹355.90
₹374.25
₹392.35 (Final Target)
Technical Rationale
✅ Bullish Flag & Pole Breakout - Classic bullish pattern confirming uptrend continuation
✅ Strong Momentum - Daily & Weekly RSI >60 (Bullish zone)
✅ Volume Confirmation - Breakout volume 10.67M vs previous day's 1.06M (Nearly 10x surge)
✅ Multi-Timeframe Alignment - Daily and weekly charts showing strength
Key Observations
• The breakout comes with significantly higher volume, validating strength
• Well-defined pattern with clear price & volume breakout
• Conservative stop loss at recent swing low
Trade Management Strategy
• Consider partial profit booking at each target level
• Move stop loss to breakeven after Target 1 is achieved
• Trail stop loss to protect profits as price progresses
Disclaimer ⚠️
This analysis is strictly for educational purposes and should not be construed as financial advice. Trading in equities involves substantial risk of capital loss. Past performance is not indicative of future results. Always conduct your own research, consider your risk appetite, and consult a financial advisor before making any investment decisions. The author assumes no responsibility for any trading outcomes based on this information.
What do you think? Are you watching NSE:RITES for this breakout opportunity? Share your views in the comments!

Rites ChartRites Ready to fly target 340. I have also given you the snapshot of the analysis done by me.

Chart Analysis for RITES Ltd.Trend Analysis:
The chart indicates a recovery after a period of consolidation. The recent upward momentum suggests a potential bullish trend.
Key Levels:
Support Level: Around ₹210 - ₹215, where price has previously bounced back.
Resistance Level: Near ₹225, where price has encountered selling pressure.
Volume Insights:
There is a notable increase in volume during the recent price movements, which indicates strong buying interest and possible continuation of the trend.
Candlestick Patterns:
The last few daily candles are predominantly bullish, indicating strong buying activity. A breakout above the recent highs might provide more confirmation for the bullish trend.
Trading Plan
Bullish Scenario
Entry Point:
Buy if the price breaks above ₹225 with strong volume, confirming the bullish breakout.
Target Price:
Set a target around ₹240 - ₹250, which aligns with previous resistance levels.
Stop-Loss:
Place a stop-loss around ₹210 to protect against a significant reversal.
Bearish Scenario
Entry Point:
Consider shorting if the price drops below ₹210 with substantial volume, indicating a potential trend reversal.
Target Price:
Look for profit-taking opportunities near the support level of ₹200.
Stop-Loss:
Place a stop-loss above ₹215 to mitigate risk.
Risk Management
Maintain a risk-to-reward ratio of at least 1:2.
Adjust position sizes according to your overall portfolio risk tolerance.
Monitoring and Adaptation
Keep an eye on market news and broader economic indicators that may affect RITES Ltd.
Continuously review support and resistance levels and adjust your trading plan as necessary based on price action and volume.
Conclusion
This trading plan capitalizes on the bullish momentum indicated by recent price movements. Adjust your strategy according to market conditions and remain alert to any signals of a trend reversal.

RITES TARGET 397 STOPLOSS 270Script is taken long term monthly uptrend channel support taken in the and bullish in weekly closing. Target is 397.

Result play in RITES around 292-295 levels A lond Trade Can be initiated in RITES around 288-295 levels with sl around 280-282 levels for target of 312+++ 318+++ 327+++ 335 ++++ maintain strict sl and hold for the target.

TURNING BULLISH: RITESRITES HAS BEEN IN A DOWNTREND FOR THE PAST COUPLE OF MONTHS.
RECENTLY IT HAS BOUNCED BACK STRONGLY FROM THE SUPPORT LEVEL OF 648.
NEXT RESISTANCE LEVELS: 767 - 783.
CONS: Sharp decline in quarterly profit from Rs. 176 Cr (Mar 2024) to Rs. 106 Cr. (Jun 2024).
Similarly, sales declined from Rs. 2,628 Cr (Mar 2023) to Rs. 2,453 Cr (Mar 2024).

RITES Date 31.08.2024
RITES
Timeframe : Day chart
At 200 ema & consolidating from few days. Recently there's positive development with respect to new order.
(RITES: CO HAS EMERGED AS THE LOWEST BIDDER (L-1) FOR A USD 2.67 CR CONTRACT TO SUPPLY, TEST, AND COMMISSION 4 DIESEL MULTIPLE UNITS FOR TANZANIA RAILWAYS CORPORATION, PENDING FINAL AWARD)
Regards,
Ankur

RITES | BUY Analysis: RITES shows strong uptrend potential with good technical
Entry: Can consider current price
Disclaimer: For informational purposes only. Do your research or consult a financial advisor.

Rites Looking Very Strong :- Keep in Radar
✅The stock has been moving within an ascending triangle pattern, which indicates a potential bullish breakout. It recently tested the upper resistance trendline and showed a strong upward movement with significant volume, suggesting a breakout towards higher levels. The support level is maintained at the lower trendline, providing a good risk-reward ratio.
✅RITES Ltd has a robust order book, which includes various national and international projects. Recently, the company secured a significant contract from the Indian Railways worth ₹300 crore, which has boosted investor confidence. The company's consistent performance and strategic expansions into new markets are expected to drive future growth.

RITES LTD - Swing Trade Analysis - 13th July #stocksRITES LTD (1W TF) - Swing Trade Analysis given on 13th July, 2024
Pattern: RECTANGLE BOX BREAKOUT
- Weekly Resistance Breakout - Done ✓
- Weekly Volume Buildup at Resistance - Done ✓
- Demand Zone Retest & Consolidation (for a small SL and a better RR) - In Progress
* Disclaimer

RITES | SWING BUYAnalysis: RITES shows strong uptrend potential with good technical
Entry: Consider current price
Disclaimer: For informational purposes only. Do your research or consult a financial advisor.

2 Swing trading ideas for 5 July MarketsI daily make educational content videos for swing / positional trading

Rites - Symmetrical Traingle.Time Frame : Weekly
### Technical Analysis:
1. **Symmetrical Triangle Pattern**:
- The chart shows a symmetrical triangle pattern, which is a consolidation pattern that usually leads to a continuation of the previous trend.
- The price has recently broken out of the triangle, indicating a potential bullish move.
2. **Price Movement**:
- The breakout has occurred with a significant move upwards, indicated by the large bullish candle.
- The projected target from the breakout is around 1052.65 INR, which is a 42.34% increase from the breakout point.
3. **Volume**:
- The volume has spiked during the breakout, which adds credibility to the breakout. Increased volume during breakouts generally signifies strong buying interest.
4. **RSI Divergence Indicator**:
- The RSI (Relative Strength Index) is at 58.50, which is in the bullish territory but not overbought.
- There is a noticeable bullish divergence in the RSI, where the price makes higher lows while the RSI makes lower lows. This often precedes upward price movement.
### Conclusion:
- The symmetrical triangle breakout, coupled with increased volume and RSI divergence, suggests a strong bullish outlook for RITES LTD.
- The price target based on the height of the triangle adds to the potential for a significant upside.
- Traders might consider entering a position on a pullback to the breakout level or a continuation of the current trend.

RITES: Ready for a Breakout 📈 CMP: 698
🔘 Big base
🔘 Facing resistance near the high of the 4th June candle
🔘 Multiple dry volume narrow-range candles
🔘 Cheat entry may trigger tomorrow
Deadly Combination 🪄
SL could be even smaller than 4%!


RITES LIMITED SWING & Soon BO RESEARCH TO OBSERVEDate : 09-06-2024
-------------------------------------
SWING & Soon BO RESEARCH TO OBSERVE
Rites Looks Good ABOVE 680
SL 560
Target 800, 850, 1015, 1180, 1345
Hold few weeks
Please consult your financial advisor before investing
All research for educational purposes only.

Retest & Reversal Stock With High Momentum-retest and reversal done
-broke upper trend (channel breakout) now reversing after retest with very strong candle
-rsi also reversing from support zone shows another confirmation
-volume is also in higher side
-keep in radar this can give decent return if sustains above 700

RITES LTD 🚆Green flag marked is a imp resistance
If sustains above that in weekly then bullish 📈 to 1542
781 (2nd September 2024 ) should act as a support within or on September 2024 for a possible momentum 📈 to 1542 marked on the chart.
Disclaimer:
Its a personal view not a financial advise and I assume no responsibility and liability whatever outcome arises.

Hopefulness 📈 If 370 support sustains on 3rd July then possible bounce to ( 413 ) 13th July or within 2nd week of July .
If support above 413 on 13th July or end of the 2nd week then 478 ( 23rd Aug ) is next 🚀
Disclaimer:
It's a personal view not a financial advise and I assume no responsibility and liability whatever outcome arises.

RITES - Long Setup, Move is ON...#RITES trading above Resistance of 786
Next Resistance is at 1006
Support is at 597
Here are previous charts:
Chart is self explanatory. Levels of breakout, possible up-moves (where stock may find resistances) and support (close below which, setup will be invalidated) are clearly defined.
Disclaimer: This is for demonstration and educational purpose only. This is not buying or selling recommendations. I am not SEBI registered. Please consult your financial advisor before taking any trade.
