BUY TODAY SELL TOMORROW for 5%DON’T HAVE TIME TO MANAGE YOUR TRADES?
- Take BTST trades at 3:25 pm every day
- Try to exit by taking 4-7% profit of each trade
- SL can also be maintained as closing below the low of the breakout candle
Now, why do I prefer BTST over swing trades? The primary reason is that I have observed that
−3.04 INR
844.35 M INR
67.70 B INR
269.09 M
About RattanIndia Enterprises Limited
Sector
Website
Headquarters
New Delhi
Founded
2010
ISIN
INE834M01019
FIGI
BBG00299S808
RattanIndia Enterprises Ltd. engages in the power generation and transmission. It also involves in the distribution of power and power advisory. The company was founded on November 9, 2010 and is headquartered in New Delhi, India.
Related stocks
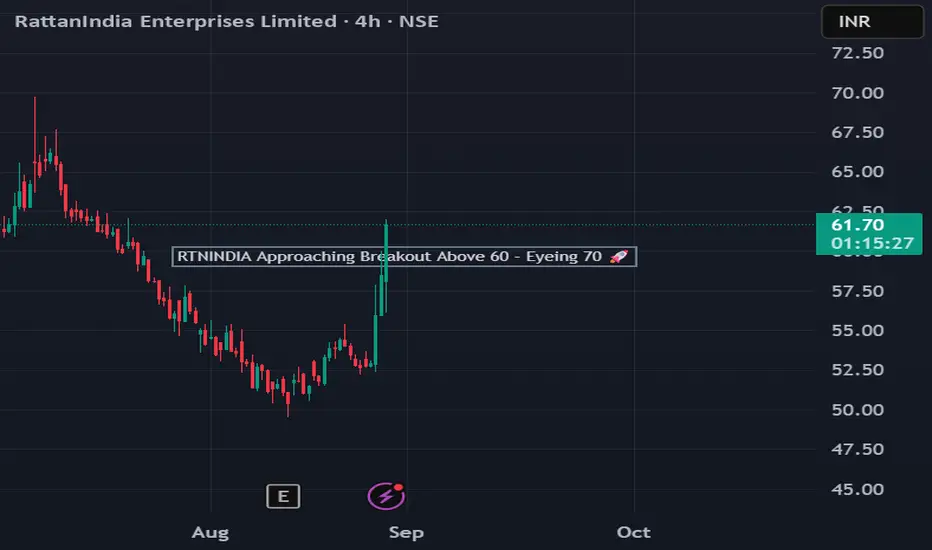
RTN INDIA approaching breakout above 60 eyeing 70Analysis:
RTNINDIA is trading close to a key resistance zone at ₹60. A decisive breakout above this level could open the way for a move towards ₹70.
On the 4H timeframe, momentum indicators and breakout signals are turning positive, suggesting fresh buying interest and strength building up.
Key Le
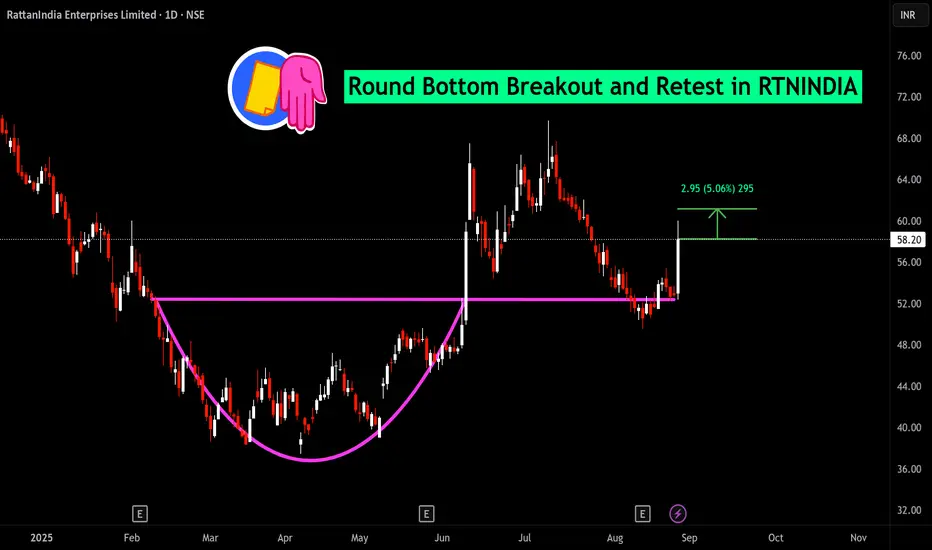
Buy today sell tomorrow for 5 -6% Rounding Bottom Breakout
Ratan India Given Rounding Bottom Breakout with good volumes. And Retest also done. We can Watch it for quick 5 -6% Swing Trading Gains .
My all views are for educational purposes only. Consult your financial advisor before making any position in stock market.
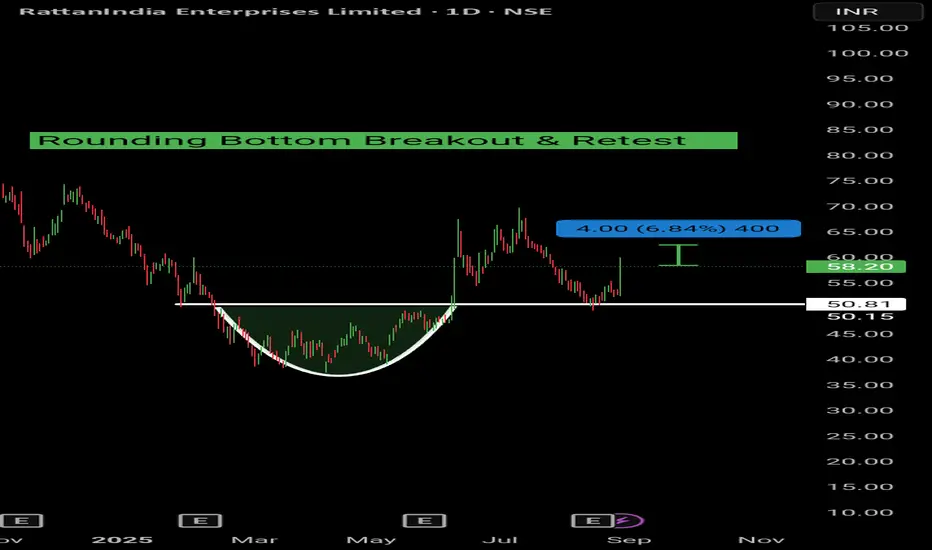
BUY TODAY SELL TOMORROW - 5-6% GAIN ROUNDING BOTTOM BREAKOUT
Rounding Bottom Breakout and Retest Done on Ratan india power. We can Watch it for 5 -6% Quick Move With High Volume. My views are for educational purposes only. Consult your financial advisor before making any position in stock market.

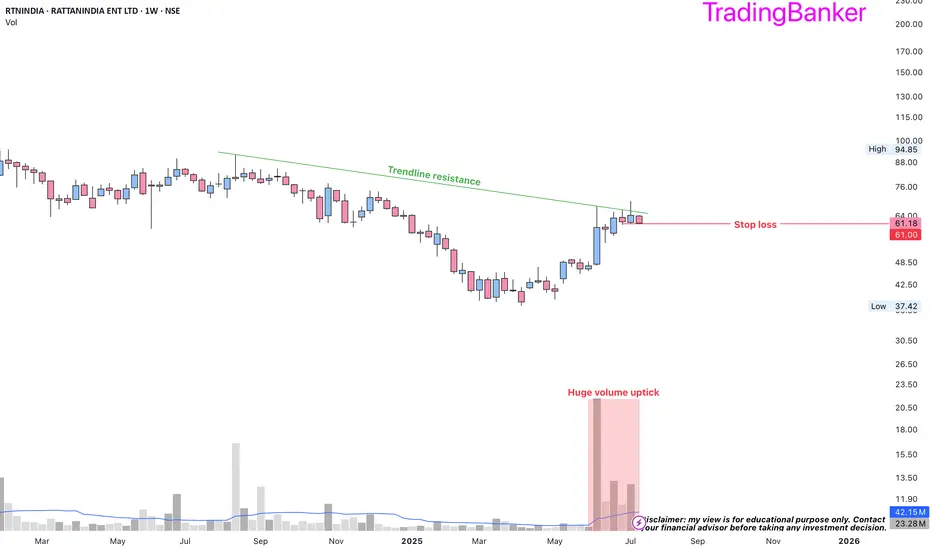
RTNINDIA: high reward to risk ratio➡️heavy volumes and big candles are the footprints of institutions
➡️Fund raising approved for business opportunities
➡️entry price 62.75 with a SL of 61
➡️since the #breakout was not confirmed, moved my SL within a few percentage points
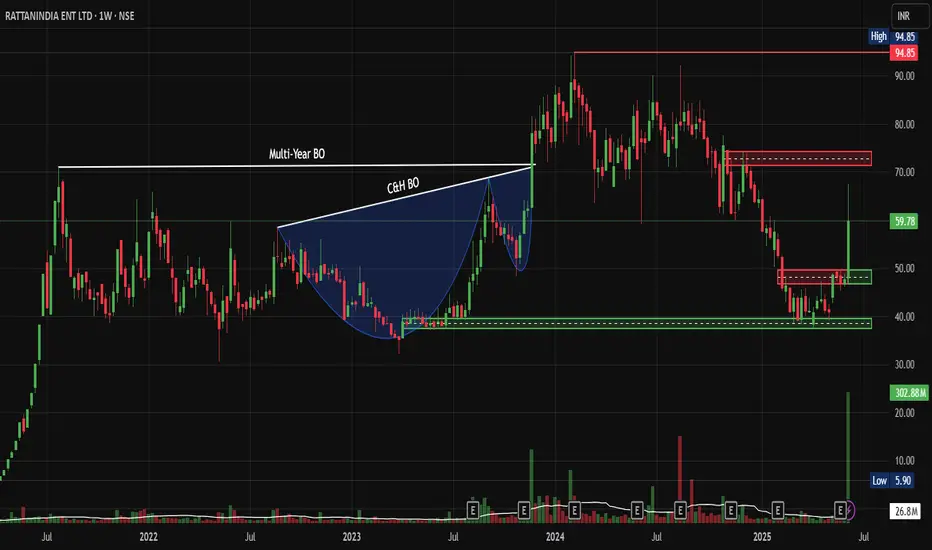
RattanIndia: Next New-Age Multi-Bagger Play ? Chart of the WeekWhy NSE:RTNINDIA Could Be Your Next Multi-Bagger Play, let's analyse my "Chart of the Week" Idea.
Price Action:
• Multiple base formations visible across the timeline from 2021-2025
• Classic cup and handle pattern formation during the 2023-2024 consolidation phase
• Rectangle consolidation pat
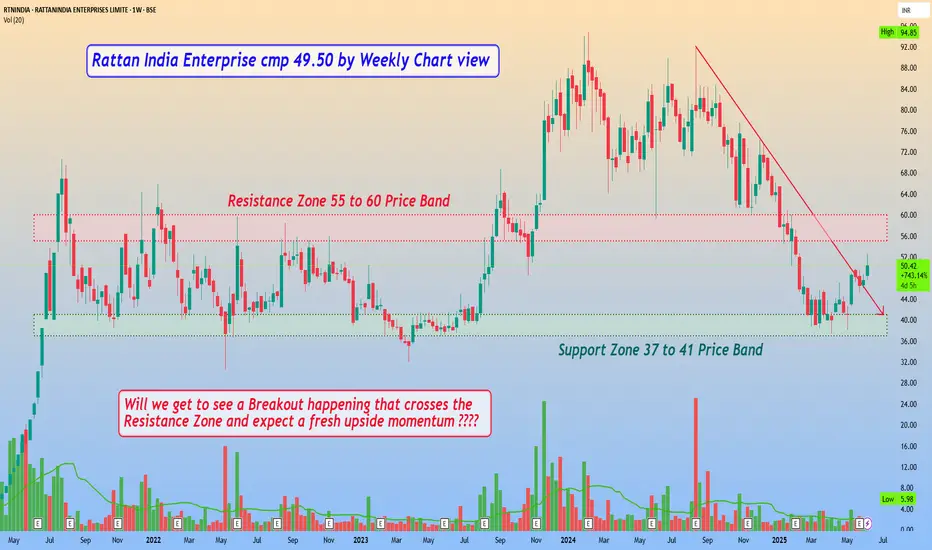
Rattan India Enterprise cmp 49.50 by Weekly Chart viewRattan India Enterprise cmp 49.50 by Weekly Chart view
- Support Zone 37 to 41 Price Band
- Resistance Zone 55 to 60 Price Band
- Volumes are getting in close sync with avg traded quantity
- Will we get to see a Breakout happening that crosses the Resistance Zone and expect a fresh upside momentum
RTNINDIA: Journey Above Crucial EMAsAfter experiencing a prolonged five-month downtrend, RTNINDIA has successfully breached its downtrend line and closed above this key resistance level, accompanied by a noticeable increase in trading volume. This upward momentum indicates a potential shift in market sentiment toward the stock.
In

Cup & Handle Breakout with Retest-Highest Net Income to Back it The Stock is A Weekly CUP n Handle Breakout which has come to Retest

TURNING BULLISH: RATTANINDIA ENTERPRISESRattanIndia has been in uptrend for the past couple of sessions.
Price above the short-, medium-, and long-term moving averages indicates strong momentum.
20EMA decisively crossed above 50EMA with decent volume.
Resistance levels: 86, 93 levels
Support: 77, 71 levels
Pros based on Fundamental Analy

See all ideas
Summarizing what the indicators are suggesting.
Oscillators
Neutral
SellBuy
Strong sellStrong buy
Strong sellSellNeutralBuyStrong buy
Oscillators
Neutral
SellBuy
Strong sellStrong buy
Strong sellSellNeutralBuyStrong buy
Summary
Neutral
SellBuy
Strong sellStrong buy
Strong sellSellNeutralBuyStrong buy
Summary
Neutral
SellBuy
Strong sellStrong buy
Strong sellSellNeutralBuyStrong buy
Summary
Neutral
SellBuy
Strong sellStrong buy
Strong sellSellNeutralBuyStrong buy
Moving Averages
Neutral
SellBuy
Strong sellStrong buy
Strong sellSellNeutralBuyStrong buy
Moving Averages
Neutral
SellBuy
Strong sellStrong buy
Strong sellSellNeutralBuyStrong buy
Displays a symbol's price movements over previous years to identify recurring trends.
HESC
HSBC ETFs PLC - HSBC MSCI Emerging Markets Small Cap Screened UCITS ETFWeight
0.02%
Market value
9.22 K
USD
Explore more ETFs
Frequently Asked Questions
The current price of RTNINDIA is 42.32 INR — it has increased by 0.51% in the past 24 hours. Watch RattanIndia Enterprises Limited stock price performance more closely on the chart.
Depending on the exchange, the stock ticker may vary. For instance, on NSE exchange RattanIndia Enterprises Limited stocks are traded under the ticker RTNINDIA.
RTNINDIA stock has risen by 0.85% compared to the previous week, the month change is a −18.54% fall, over the last year RattanIndia Enterprises Limited has showed a −36.93% decrease.
RTNINDIA reached its all-time high on Feb 8, 2024 with the price of 94.85 INR, and its all-time low was 1.15 INR and was reached on Aug 23, 2019. View more price dynamics on RTNINDIA chart.
See other stocks reaching their highest and lowest prices.
See other stocks reaching their highest and lowest prices.
RTNINDIA stock is 2.42% volatile and has beta coefficient of 1.47. Track RattanIndia Enterprises Limited stock price on the chart and check out the list of the most volatile stocks — is RattanIndia Enterprises Limited there?
Today RattanIndia Enterprises Limited has the market capitalization of 59.13 B, it has increased by 1.07% over the last week.
Yes, you can track RattanIndia Enterprises Limited financials in yearly and quarterly reports right on TradingView.
RTNINDIA net income for the last quarter is −3.97 B INR, while the quarter before that showed 5.03 B INR of net income which accounts for −178.88% change. Track more RattanIndia Enterprises Limited financial stats to get the full picture.
No, RTNINDIA doesn't pay any dividends to its shareholders. But don't worry, we've prepared a list of high-dividend stocks for you.
As of Dec 3, 2025, the company has 28 employees. See our rating of the largest employees — is RattanIndia Enterprises Limited on this list?
EBITDA measures a company's operating performance, its growth signifies an improvement in the efficiency of a company. RattanIndia Enterprises Limited EBITDA is 6.75 B INR, and current EBITDA margin is 2.49%. See more stats in RattanIndia Enterprises Limited financial statements.
Like other stocks, RTNINDIA shares are traded on stock exchanges, e.g. Nasdaq, Nyse, Euronext, and the easiest way to buy them is through an online stock broker. To do this, you need to open an account and follow a broker's procedures, then start trading. You can trade RattanIndia Enterprises Limited stock right from TradingView charts — choose your broker and connect to your account.
Investing in stocks requires a comprehensive research: you should carefully study all the available data, e.g. company's financials, related news, and its technical analysis. So RattanIndia Enterprises Limited technincal analysis shows the strong sell today, and its 1 week rating is sell. Since market conditions are prone to changes, it's worth looking a bit further into the future — according to the 1 month rating RattanIndia Enterprises Limited stock shows the sell signal. See more of RattanIndia Enterprises Limited technicals for a more comprehensive analysis.
If you're still not sure, try looking for inspiration in our curated watchlists.
If you're still not sure, try looking for inspiration in our curated watchlists.