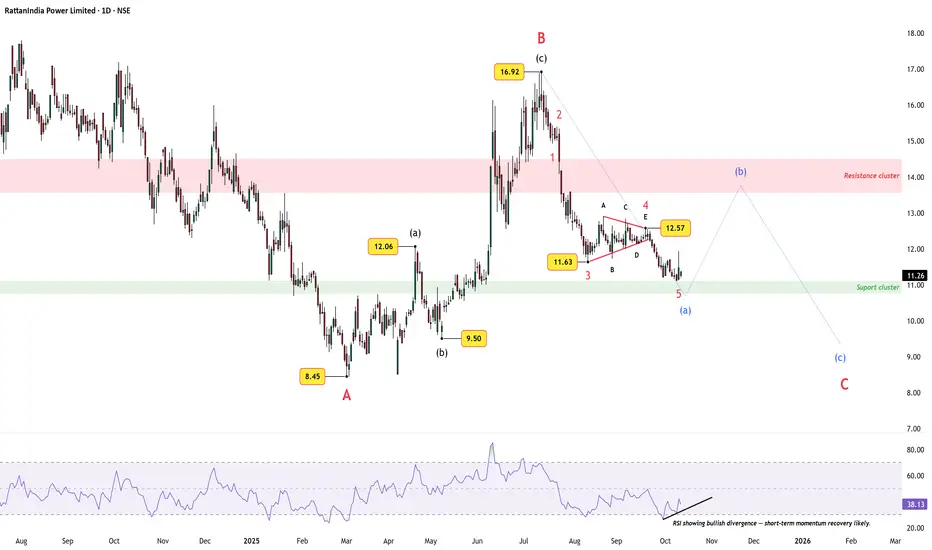
RattanIndia Power: Short-Term Bounce Within Larger CorrectionAfter an extended five-wave decline from the ₹16.92 peak, RattanIndia Power appears to have completed a smaller-degree Wave (a) near the support cluster around ₹11. The substructure shows a clean 1-2-3-4-5 sequence, with Wave 4 forming a contracting triangle and Wave 5 bottoming right into the green
RattanIndia Power Limited
No trades
0.25 INR
2.22 B INR
32.84 B INR
2.68 B
About RattanIndia Power Limited
Sector
Industry
Website
Headquarters
New Delhi
Founded
2007
IPO date
Oct 30, 2009
Identifiers
2
ISIN INE399K01017
RattanIndia Power Ltd. engages in the development, operation and maintainance of coal based thermal power projects. It focuses on power generation, distribution, trading, transmission, and other ancillary and incidental activities. The company was founded by Rajiv Rattan on October 8, 2007 and is headquartered in New Delhi, India.
Related stocks
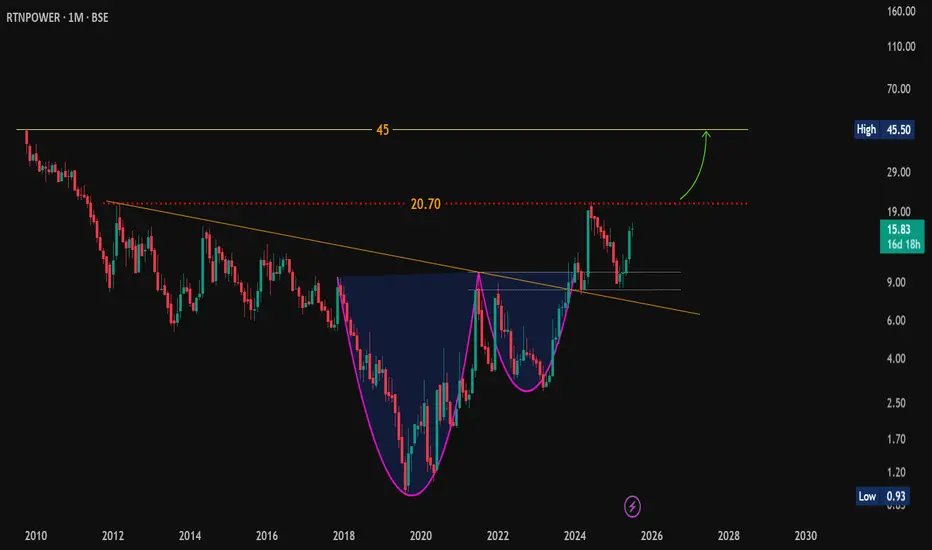
RTNPOWER Nearing Breakout Zone Again After Retest#OnRadar
#RTNPOWER (RattanIndia Power Ltd.)
CMP: 15.83
Support Zone: 10.00 – 7.90
📊 Technical Outlook:
Earlier gave a strong breakout from a Cup & Handle pattern on the long-term chart, rallying up to 21.13. However, it failed to close above the 2012 high of 20.70 on a monthly basis, tr
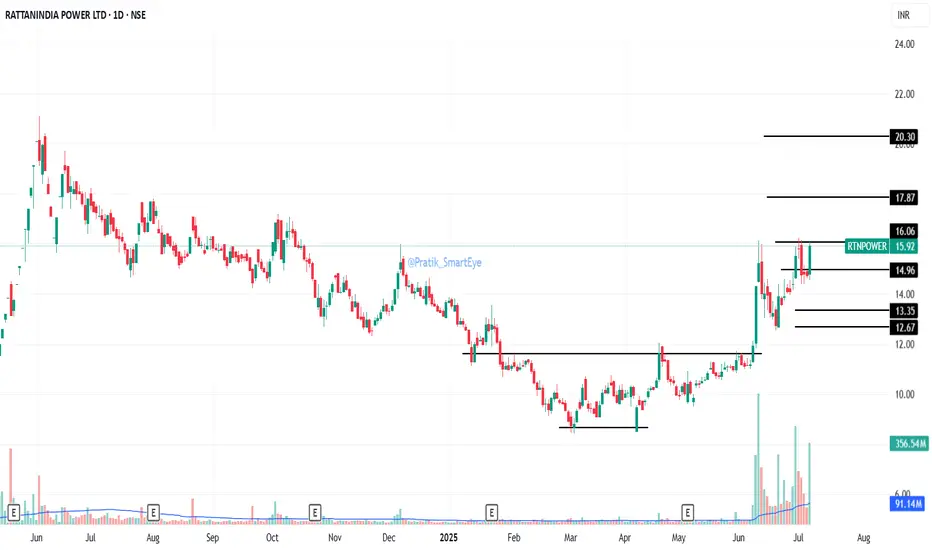
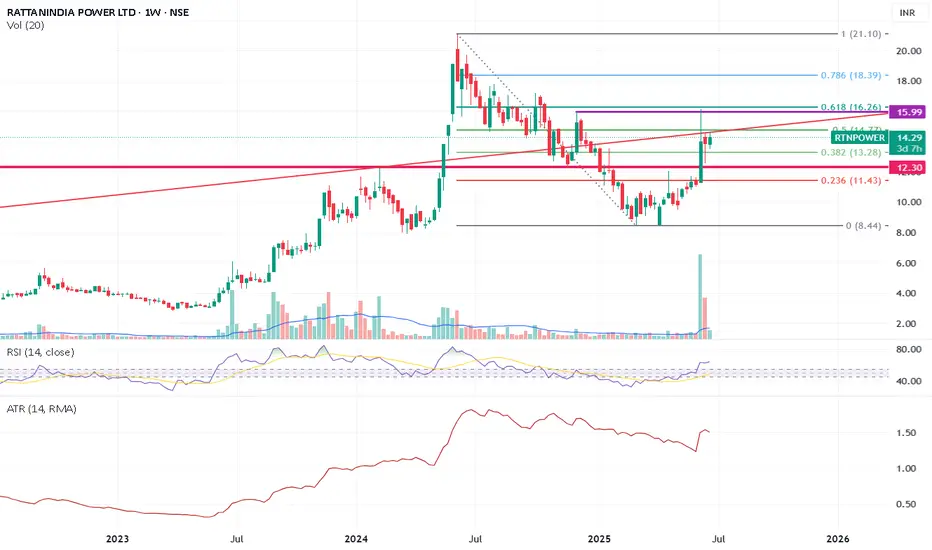
Rattan Power: Bounce From Support zoneRattan Power: Bounce From Support zone 14.95; CMP 15.55
Resistance at 16.06/17.87/20.30
Support 14.95/13.35
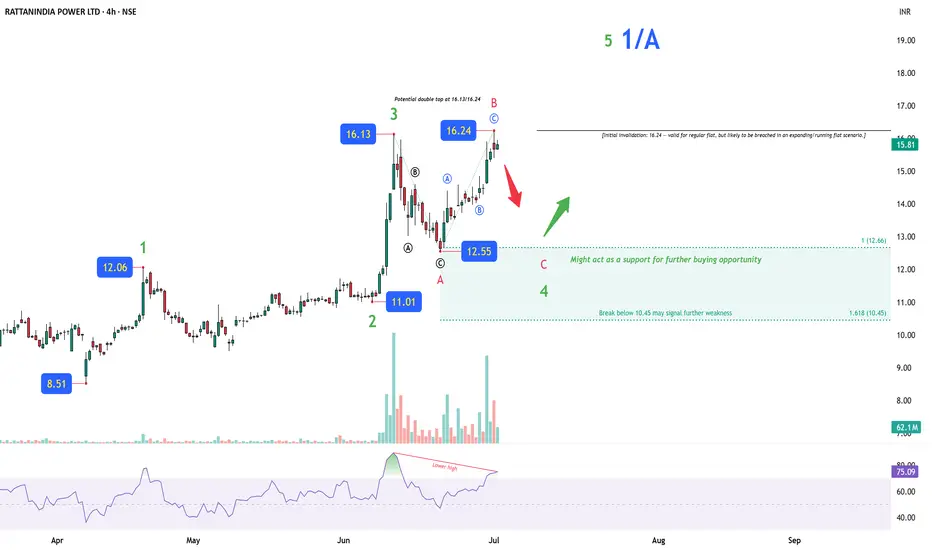
RattanIndia Power – Don’t Let the Hype Blindside YouRattanIndia Power, a penny stock, has been making the rounds lately with a sharp rally from ₹8.51 to ₹16.24. The buzz is strong, and retail interest is rising—but even with penny stocks, it’s worth taking a proper technical look before jumping in.
The current structure resembles a flat correction,
RATTANINDIA POWER LTDTechnical View:
Price: ₹14.39 (+3.60%)
Volume: Very strong volume (~645M), indicating institutional interest or strong buying pressure.
EMA: Price is trading well above the EMA – confirms short-term bullish strength.
RSI: Currently at 66.67 – strong positive momentum.
Chart Pattern View:
Price i

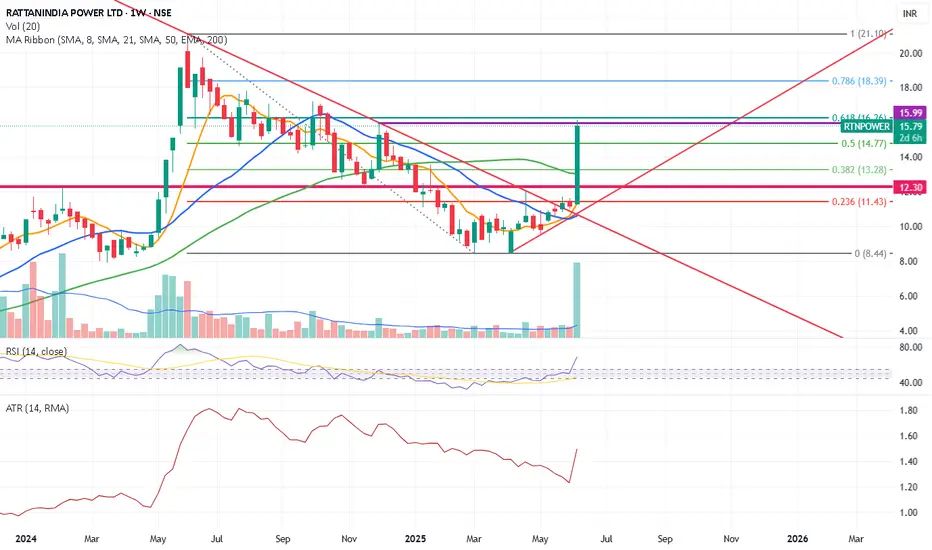
Trendline resistance in Rattan India PowerTrendline resistance waiting to be broken in Rattan India Power. It had gained momentum 2 weeks back but it died down. May be was a rally which could not hold. Expecting a consolidation before we see any big rally now. But things can change as its difficult to predict market. Let the technical speak
A GOOD STRUCTURE ON WTF BUT A RESISITENCE ON MTF ALSOA good setup on WTF
MTF RESISTENCE ALSO
WE can buy after MTF closing but before that a good consolidation on WTF AND DTF

A big resistance to breakRattan Power has a big resistance now after the rally. It seems all the ammunitions have been consumed and we can see a consolidation till next move.
RTNPOWER – A Classic Price Action Study Around Major Trendlines🟦 Dotted Blue Line
Represents the main counter trendline, stretched over a significant duration. Price has currently pushed above it, but the weekly candle is still open.
⬜ White Line (Hidden CT)
A hidden resistance line, drawn from key lower highs. Price is currently reacting near this line — acti

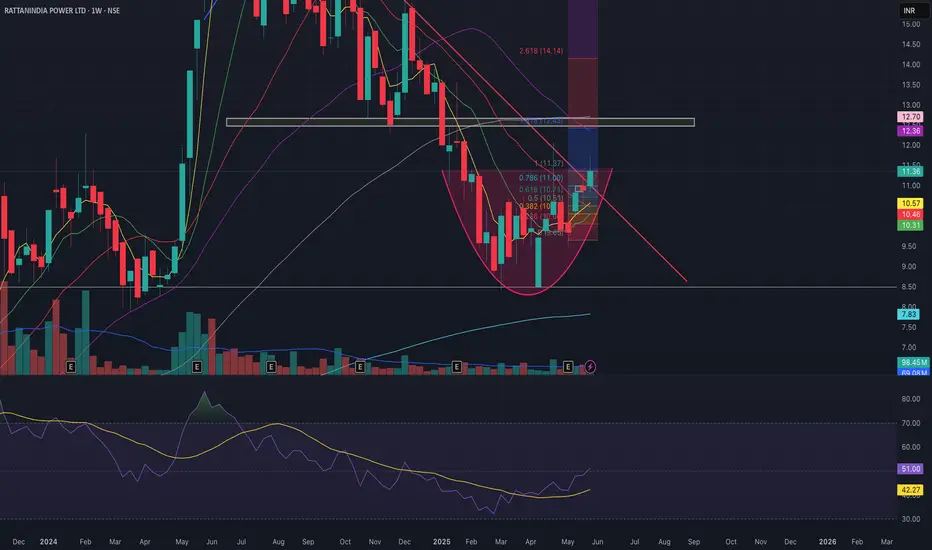
RATTAN POWER ready to give a 10% upside soonCUP pattern in W.
RSI divergence with strength.
MA supports taken.
Broken the monthly downtrend.
Continuous buildups in W.
Target of 12 to 13 with SL:10.30 CMP: 11.36
See all ideas
Summarizing what the indicators are suggesting.
Oscillators
Neutral
SellBuy
Strong sellStrong buy
Strong sellSellNeutralBuyStrong buy
Oscillators
Neutral
SellBuy
Strong sellStrong buy
Strong sellSellNeutralBuyStrong buy
Summary
Neutral
SellBuy
Strong sellStrong buy
Strong sellSellNeutralBuyStrong buy
Summary
Neutral
SellBuy
Strong sellStrong buy
Strong sellSellNeutralBuyStrong buy
Summary
Neutral
SellBuy
Strong sellStrong buy
Strong sellSellNeutralBuyStrong buy
Moving Averages
Neutral
SellBuy
Strong sellStrong buy
Strong sellSellNeutralBuyStrong buy
Moving Averages
Neutral
SellBuy
Strong sellStrong buy
Strong sellSellNeutralBuyStrong buy
Displays a symbol's price movements over previous years to identify recurring trends.
Frequently Asked Questions
The current price of RTNPOWER is 8.78 INR — it has decreased by −1.57% in the past 24 hours. Watch RattanIndia Power Limited stock price performance more closely on the chart.
Depending on the exchange, the stock ticker may vary. For instance, on NSE exchange RattanIndia Power Limited stocks are traded under the ticker RTNPOWER.
RTNPOWER stock has fallen by −3.20% compared to the previous week, the month change is a −1.90% fall, over the last year RattanIndia Power Limited has showed a −13.92% decrease.
RTNPOWER reached its all-time high on Oct 30, 2009 with the price of 45.05 INR, and its all-time low was 0.95 INR and was reached on Aug 23, 2019. View more price dynamics on RTNPOWER chart.
See other stocks reaching their highest and lowest prices.
See other stocks reaching their highest and lowest prices.
RTNPOWER stock is 2.76% volatile and has beta coefficient of 1.63. Track RattanIndia Power Limited stock price on the chart and check out the list of the most volatile stocks — is RattanIndia Power Limited there?
Today RattanIndia Power Limited has the market capitalization of 47.15 B, it has increased by 1.67% over the last week.
Yes, you can track RattanIndia Power Limited financials in yearly and quarterly reports right on TradingView.
RTNPOWER net income for the last quarter is 542.60 M INR, while the quarter before that showed −315.50 M INR of net income which accounts for 271.98% change. Track more RattanIndia Power Limited financial stats to get the full picture.
No, RTNPOWER doesn't pay any dividends to its shareholders. But don't worry, we've prepared a list of high-dividend stocks for you.
As of Feb 15, 2026, the company has 548 employees. See our rating of the largest employees — is RattanIndia Power Limited on this list?
EBITDA measures a company's operating performance, its growth signifies an improvement in the efficiency of a company. RattanIndia Power Limited EBITDA is 4.88 B INR, and current EBITDA margin is 18.42%. See more stats in RattanIndia Power Limited financial statements.
Like other stocks, RTNPOWER shares are traded on stock exchanges, e.g. Nasdaq, Nyse, Euronext, and the easiest way to buy them is through an online stock broker. To do this, you need to open an account and follow a broker's procedures, then start trading. You can trade RattanIndia Power Limited stock right from TradingView charts — choose your broker and connect to your account.
Investing in stocks requires a comprehensive research: you should carefully study all the available data, e.g. company's financials, related news, and its technical analysis. So RattanIndia Power Limited technincal analysis shows the sell today, and its 1 week rating is sell. Since market conditions are prone to changes, it's worth looking a bit further into the future — according to the 1 month rating RattanIndia Power Limited stock shows the neutral signal. See more of RattanIndia Power Limited technicals for a more comprehensive analysis.
If you're still not sure, try looking for inspiration in our curated watchlists.
If you're still not sure, try looking for inspiration in our curated watchlists.