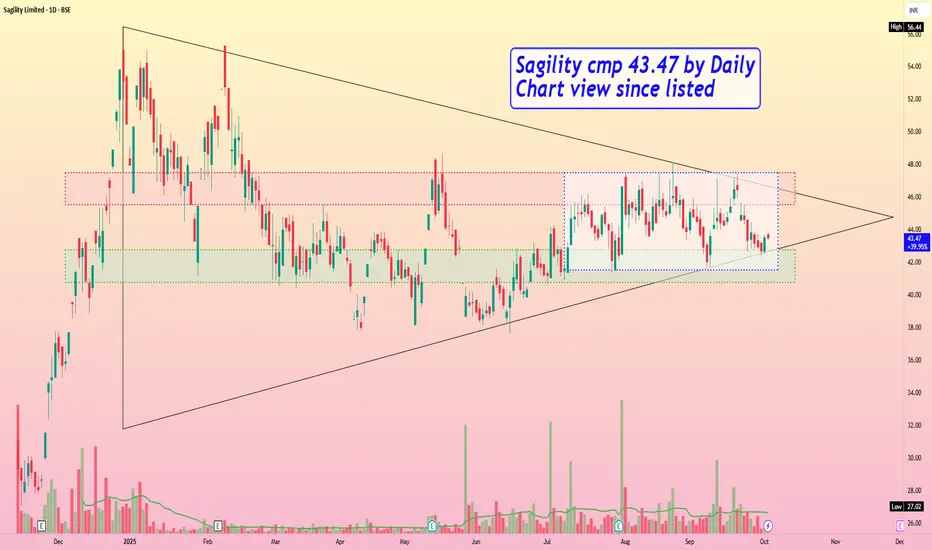
Sagility cmp 43.47 by Daily Chart view since listedSagility cmp 43.47 by Daily Chart view since listed
- Support Zone 40.75 to 42.75 Price Band
- Resistance Zone 45.50 to 47.50 Price Band
- Price traversing inside Symmetrical Triangle pattern
- Support Zone repeatedly tested rested since month of July 2025
- Price trending in Darvas Box range 41.50 to 47.50 and awaiting Breakout
- Price rejection seen by frequent selling pressure at Resistance Zone upper band
- Fresh Breakout possible basis supportive Volumes based closure above 47.50 price level for few days
Trade ideas
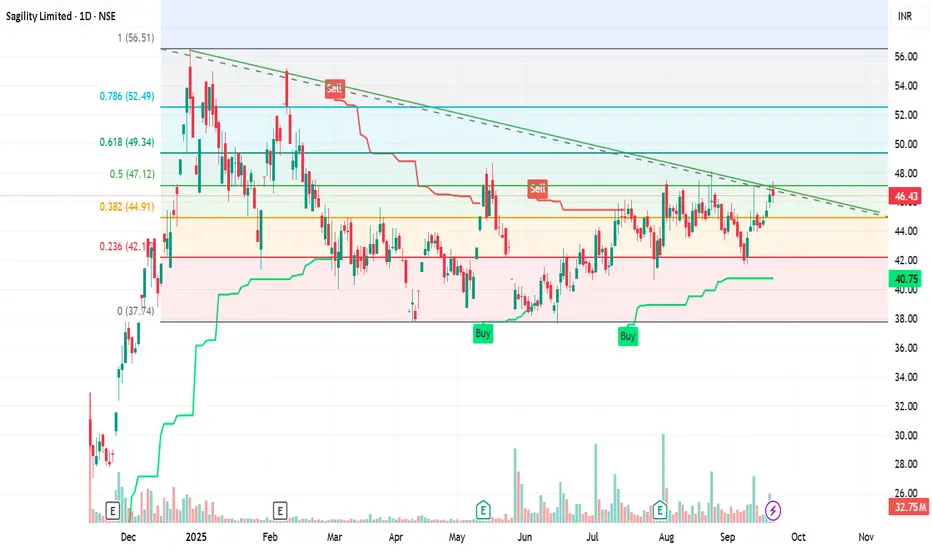
Sagility Breakout Technical AnalysisThe chart of Sagility Limited on the NSE reveals a technically rich setup with several key signals. Here's a breakdown of what it indicates:
📉 Trend Analysis
- Descending Trendline: The stock has been forming lower highs, suggesting a downtrend or bearish sentiment.
- Current Price: ₹45.60, down 1.40% on the day—still trading below key resistance levels.
🔍 Fibonacci Retracement
- Levels like 0.236, 0.382, 0.5, 0.618, and 0.786 are plotted.
- These help identify potential reversal zones. If price breaks above the 0.382 or 0.5 level, it could signal a bullish retracement.
🟩🟥 Support & Resistance Zones
- Green shaded areas: Strong support zones where buyers may step in.
- Red shaded areas: Resistance zones where selling pressure could emerge.
- Price is currently hovering near a support zone—watch for a bounce or breakdown.
📊 Volume & Momentum
- Volume bars show moderate activity, but no major spikes—suggesting consolidation.
- The green line (likely a moving average) is sloping downward, reinforcing the bearish bias unless price crosses above it.
🟢🔴 Buy/Sell Signals
- Recent “Sell” signal near the descending trendline confirms weakness.
- Previous “Buy” signals occurred near support zones—if price approaches those again, it may offer a short-term opportunity.
🧠 What to Watch For
- Breakout above the descending trendline: Could trigger bullish momentum.
- Breakdown below support: May lead to further downside.
- Volume confirmation: A spike in volume with price movement adds conviction
🧠 Strategic Takeaways
- Bullish bias only above ₹47.25 with confirmation.
- Bearish continuation if ₹42.625 breaks.
- Gann levels align well with Fibonacci zones—giving confluence
Sagility India LtdSagility India Ltd, on weekly timeframe this stock has given breakout and has potential of giving return approx. 35-40 % in few weeks. keep this in your watchlist and plan accordingly. check volume as well. FII's and DII's continuously in their holding.

Sagility break and consolidationSagility india has broken a very clear flag pattern
also sales is nice can follow stoploss of 37 for target of 55,65+
>not liable for any loss or profit ,trading includes financial risk,
only for educational purpose

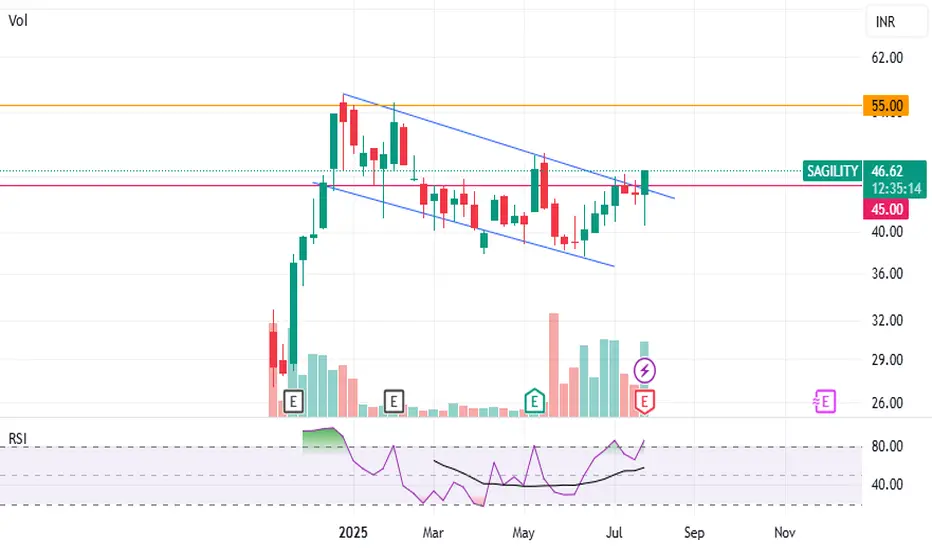
Sagility India LtdSAGILITY has been trading within a descending wedge pattern and has now broken above the upper trendline, confirming a bullish momentum. This breakout is further validated by rising volume, adding strength to the move.
Additionally, while the price was making lower lows, the RSI showed higher lows, indicating underlying strength. The stock is also trading above key moving averages, suggesting a continued bullish bias.
If it sustains above 45, targets of 52 and 55 seem achievable. If it closes above 55, it could unlock higher levels.
Sagility India Limited Trade Information
Traded Volume (Lakhs) 194.42
Traded Value (₹ Cr.) 87.90
Total Market Cap (₹ Cr.) 21,019.16
Free Float Market Cap (₹ Cr.) 6,857.12
Impact cost 0.87
% of Deliverable / Traded
Quantity 47.47 %
Applicable Margin Rate 17.77
Face Value 10
Price Information
52 Week High (30-Dec-2024) 56.40
52 Week Low (13-Nov-2024) 27.02
Upper Band 50.09
Lower Band 40.98
Price Band (%) 10
Daily Volatility 2.22
Annualised Volatility 42.41
Tick Size 0.01
Adjusted P/E 41.25
Symbol P/E 41.25
Index NIFTY 500
Basic Industry IT Enabled Service

SAGILITY INDIA📈 **Sagility India Ltd – Breakout Watch (Daily Timeframe)**
After consolidating in a **descending triangle** for several months, Sagility India is now attempting a **breakout above the falling trendline** resistance.
🔶 **Structure**:
* Horizontal base around ₹38
* Lower highs forming a compressing range
* Price has now convincingly touched and pierced the upper trendline
🔶 **Current Price Action**:
* Today's candle is strong and shows good momentum (+4.83%)
* Volume confirmation (if available) will be key to validate the breakout
* A sustained close above ₹45 zone may signal start of a new trend
📌 **Watchlist for Confirmation**:
* Follow-through candle tomorrow
* Retest of trendline (optional but healthy)
* Next resistance around ₹50-52
💡 **Trade Plan**:
Not a recommendation — just an observation. If this breakout sustains, it may open up higher targets. Keep risk management tight, especially since the stock is coming from a prolonged consolidation.

Swing Setup: Sagility India Ltd (NSE)📍 Buy zone: ₹ 40 – 41
🛡️ Stop: ₹ 38 (≈ ₹ 2 risk)
🎯 Target-1: ₹ 45 — book part or trail
⚡ Breakout trigger: daily close > ₹ 42 on strong volume → ride toward ₹ 48-50
Why it’s on the radar
• Price is consolidating near support, holding above the 20-DMA with a potential reversal setup.
• Recent weekly candles hint at accumulation as price is testing key levels, showing signs of demand.
• The IT services sector has fresh demand, with a rise in outsourcing and automation orders fueling growth.
Execution rules
1. Risk ≤ 2 % of capital (₹ 2 × shares per ₹ 10 k).
2. Shift stop to entry once ₹ 45 prints.
3. Exit early on a daily close below ₹ 38 or if RSI drops under 45.
4. No follow-through within ten sessions? Close and reassess.
Trade with a plan—patience and discipline bring results. 💪
Not financial advice—just sharing my game plan. Manage your own risk and stay disciplined. 💹
