SAMMAANCAP 1 Month Time Frame 📈 Current Snapshot (as reference)
Last traded / recent price around ~₹147 – ₹151 on NSE (varies with intraday moves).
52‑week range: ~₹97 – ₹192.9.
🔑 1‑Month Key Levels – NSE Pivot, Support & Resistance
Monthly Pivot Levels (short‑term framework):
These come from pivot analysis that captures inte
Sammaan Capital Ltd
No trades
Next report date
—
Report period
—
EPS estimate
—
Revenue estimate
—
15.86 INR
−18.07 B INR
84.58 B INR
786.09 M
About Sammaan Capital Ltd
Sector
Industry
CEO
Gagan Banga
Website
Headquarters
Mumbai
Founded
2005
IPO date
Jul 23, 2013
Identifiers
2
ISIN INE148I01020
Sammaan Capital Ltd. is a holding company, which engages in the operation of financing institutions which specializes in housing finance, real estate, and wealth management. It operates through the Investing and Financing Related Activities; and Fee Income segments. The Investing and Financing Related Activities segment involves in investing and financing related activities in various subsidiaries, financing of loans, and credit activities. The Fee Income segment comprises of financial service related fee from services income, commission on insurance, and other fee based activities. The company was founded by Sameer Gehlaut on May 10, 2005 and is headquartered in Mumbai, India.
Related stocks

#samman capital rebound from lower levels #samman capital rebound from lower levels
add above 149 for 170/192...
stoploss 137 strict

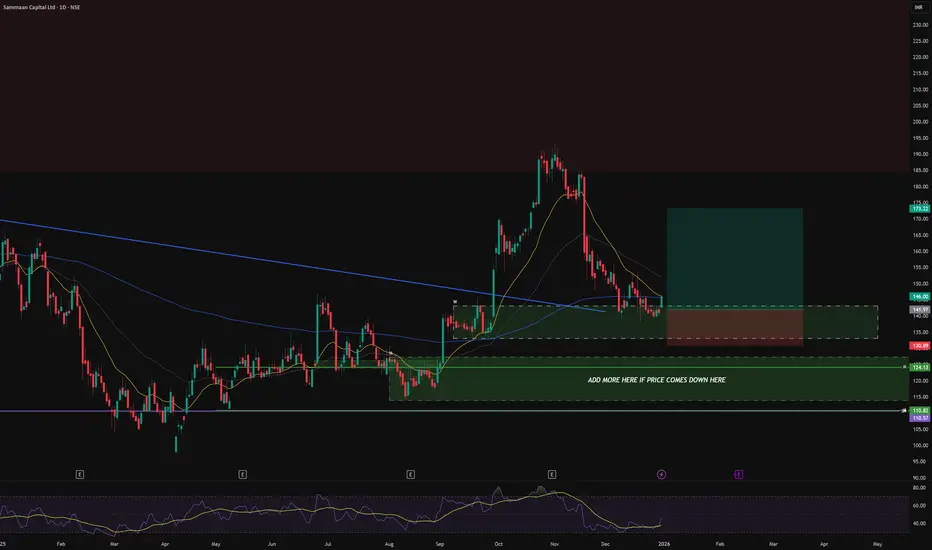
SAMMAANCAP- trading as well as investing planSAMMAANCAP looks good at CMP
the entry i have taken and the target both are mentioned on the chart
can add the stock for investing and trading both
there is a very good MDZ below this zone
can add more in that marked box
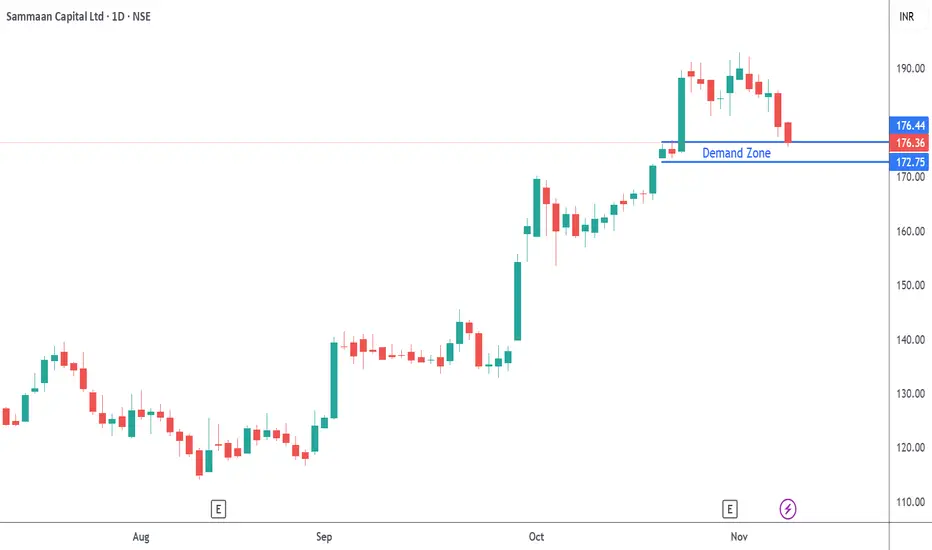
Sammaan Capital – Demand Zone Reversal PlaySammaan Capital – Demand Zone Reversal Play 📈
Price action respected a well-defined demand zone, indicating strong buyer interest. Entry was considered after confirmation of bullish intent marked by a clean rally follow-through candle. Risk-reward aligned with prior structure, and volume supported
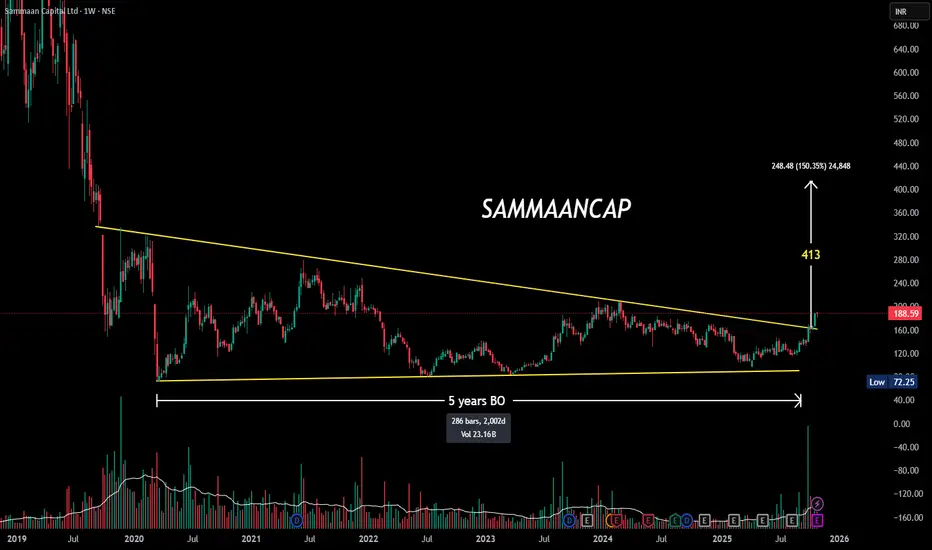
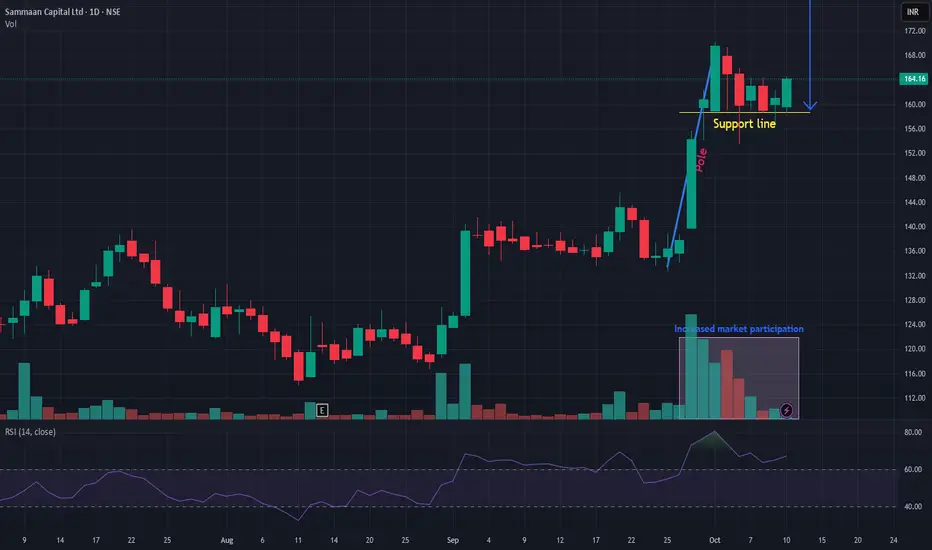
SAMMAANCAP | 5-Year Symmetrical Triangle Breakout at ₹165!📈 #SAMMAANCAP | #TechnicalAnalysis
💥 5-Year Symmetrical Triangle Breakout at ₹165!
After a long consolidation, price breaks out with rising volume — a strong sign of trend reversal despite current negative earnings.
🔹 Pattern: Symmetrical Triangle
🔹 Breakout Zone: ₹165
🔹 CMP: ₹188
🔹 P/E: -5.9 (Los
BUY TODAY SELL TOMORROW for 5%DON’T HAVE TIME TO MANAGE YOUR TRADES?
- Take BTST trades at 3:25 pm every day
- Try to exit by taking 4-7% profit of each trade
- SL can also be maintained as closing below the low of the breakout candle
Now, why do I prefer BTST over swing trades? The primary reason is that I have observed that
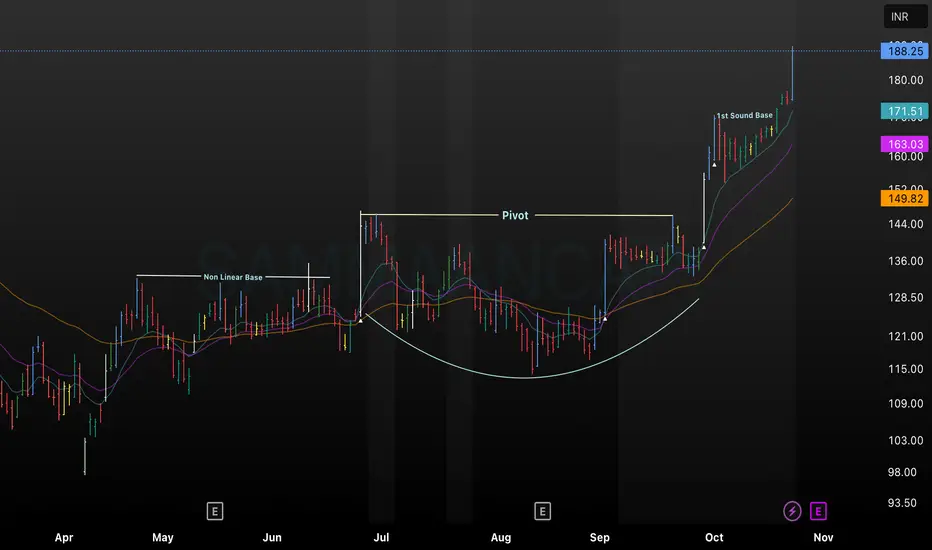
Cup and Handle Breakout with Non-Linear Base and Sound BaseThis TradingView chart displays a textbook Cup and Handle breakout pattern in Sammaan Capital (SAMMAANCAP). The setup begins with a “Non Linear Base,” transitions into an extended consolidation, and establishes a clear pivot zone before the breakout. A rapid surge follows, confirmed by the formation
Samman capital Stock same like pn gadgil,
Absorption selling pressure,
Break selling started area.
Risk 8%
Target 20% after trailing with 20/30 moving average
Fundamentals -
Recently many things happen
Oct 17: Allotted ₹400 Cr in NCDs (9.15-9.30% coupon, maturity 2030-35). Raises liquidity for lending; listed

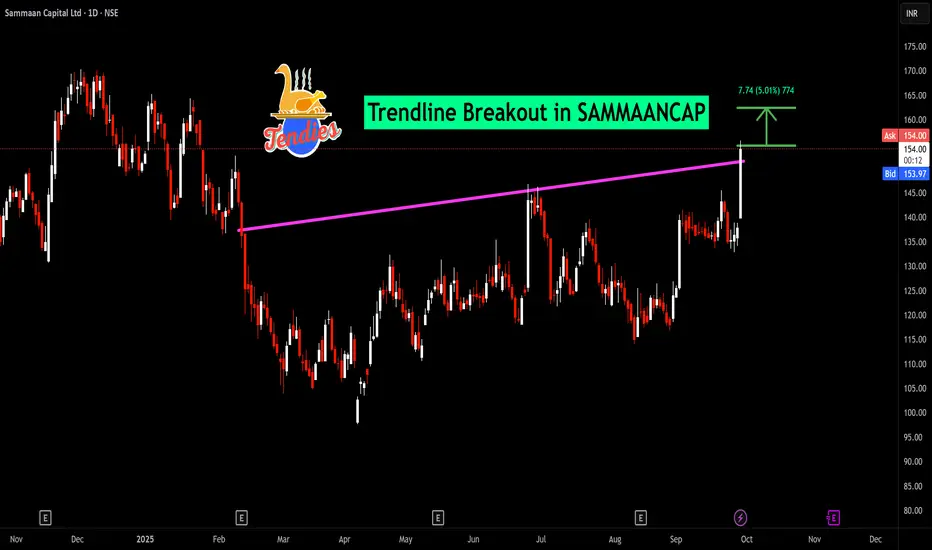
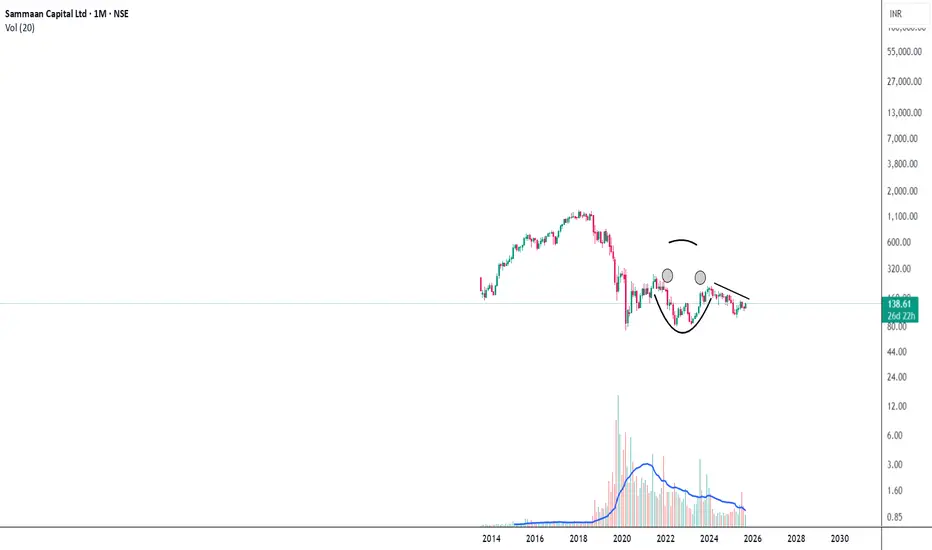
Sammaan Capital Ltd. Current Price is : 138In this chart you see the "SAMMAANCAP" candlestick chart where we this see that it looks something like a Cup & Handle Pattern.
We may see a big upside move once it breaks the trend line. ( Right Side )
I believe maybe in upcoming 3 months this price can cross 400.
This is no financial advic
SAMMAANCAP SAMMAANCAP is showing very good strength and currently available at low risk. Forming VCP pattern. Seems like currently facing from sideways and may come out of the range and will take a new ride above resistance line. Risk-reward quite in favor. Keep it in a watchlist.
See all ideas
Summarizing what the indicators are suggesting.
Oscillators
Neutral
SellBuy
Strong sellStrong buy
Strong sellSellNeutralBuyStrong buy
Oscillators
Neutral
SellBuy
Strong sellStrong buy
Strong sellSellNeutralBuyStrong buy
Summary
Neutral
SellBuy
Strong sellStrong buy
Strong sellSellNeutralBuyStrong buy
Summary
Neutral
SellBuy
Strong sellStrong buy
Strong sellSellNeutralBuyStrong buy
Summary
Neutral
SellBuy
Strong sellStrong buy
Strong sellSellNeutralBuyStrong buy
Moving Averages
Neutral
SellBuy
Strong sellStrong buy
Strong sellSellNeutralBuyStrong buy
Moving Averages
Neutral
SellBuy
Strong sellStrong buy
Strong sellSellNeutralBuyStrong buy
Displays a symbol's price movements over previous years to identify recurring trends.
S
1030SFIL28.NM
Sammaan Finserve Ltd. 10.3% 02-FEB-2028Yield to maturity
56.80%
Maturity date
Feb 2, 2028
925SCL26B.YQ
Sammaan Capital Limited 9.25% 26-MAR-2026Yield to maturity
13.03%
Maturity date
Mar 26, 2026
948SCL27D.N1
Sammaan Capital Limited 9.48% 25-SEP-2027Yield to maturity
12.82%
Maturity date
Sep 25, 2027
948SCL27R.N1
Sammaan Capital Limited 9.48% 27-DEC-2027Yield to maturity
12.56%
Maturity date
Dec 27, 2027
See all SAMMAANCAP bonds
TLTE
FlexShares Morningstar Emerging Markets Factor Tilt Index FundWeight
0.13%
Market value
410.35 K
USD
MOSMALL250
Motilal Oswal Nifty Smallcap 250 ETF Units Exchange Traded FundWeight
0.56%
Market value
89.67 K
USD
Explore more ETFs
Frequently Asked Questions
The current price of SAMMAANCAP is 148.35 INR — it has increased by 0.70% in the past 24 hours. Watch Sammaan Capital Ltd stock price performance more closely on the chart.
Depending on the exchange, the stock ticker may vary. For instance, on NSE exchange Sammaan Capital Ltd stocks are traded under the ticker SAMMAANCAP.
SAMMAANCAP stock has risen by 0.32% compared to the previous week, the month change is a 2.60% rise, over the last year Sammaan Capital Ltd has showed a 3.74% increase.
SAMMAANCAP reached its all-time high on Jan 29, 2018 with the price of 1,284.40 INR, and its all-time low was 72.25 INR and was reached on Mar 20, 2020. View more price dynamics on SAMMAANCAP chart.
See other stocks reaching their highest and lowest prices.
See other stocks reaching their highest and lowest prices.
SAMMAANCAP stock is 2.15% volatile and has beta coefficient of 2.06. Track Sammaan Capital Ltd stock price on the chart and check out the list of the most volatile stocks — is Sammaan Capital Ltd there?
Today Sammaan Capital Ltd has the market capitalization of 120.08 B, it has increased by 1.36% over the last week.
Yes, you can track Sammaan Capital Ltd financials in yearly and quarterly reports right on TradingView.
Sammaan Capital Ltd is going to release the next earnings report on May 15, 2026. Keep track of upcoming events with our Earnings Calendar.
SAMMAANCAP net income for the last quarter is 3.14 B INR, while the quarter before that showed 3.08 B INR of net income which accounts for 1.82% change. Track more Sammaan Capital Ltd financial stats to get the full picture.
Yes, SAMMAANCAP dividends are paid annually. The last dividend per share was 2.00 INR. As of today, Dividend Yield (TTM)% is 1.36%. Tracking Sammaan Capital Ltd dividends might help you take more informed decisions.
As of Feb 11, 2026, the company has 4.58 K employees. See our rating of the largest employees — is Sammaan Capital Ltd on this list?
EBITDA measures a company's operating performance, its growth signifies an improvement in the efficiency of a company. Sammaan Capital Ltd EBITDA is 28.14 B INR, and current EBITDA margin is 95.58%. See more stats in Sammaan Capital Ltd financial statements.
Like other stocks, SAMMAANCAP shares are traded on stock exchanges, e.g. Nasdaq, Nyse, Euronext, and the easiest way to buy them is through an online stock broker. To do this, you need to open an account and follow a broker's procedures, then start trading. You can trade Sammaan Capital Ltd stock right from TradingView charts — choose your broker and connect to your account.
Investing in stocks requires a comprehensive research: you should carefully study all the available data, e.g. company's financials, related news, and its technical analysis. So Sammaan Capital Ltd technincal analysis shows the buy rating today, and its 1 week rating is buy. Since market conditions are prone to changes, it's worth looking a bit further into the future — according to the 1 month rating Sammaan Capital Ltd stock shows the sell signal. See more of Sammaan Capital Ltd technicals for a more comprehensive analysis.
If you're still not sure, try looking for inspiration in our curated watchlists.
If you're still not sure, try looking for inspiration in our curated watchlists.