SCHNEIDER - BAT 0.8 revThe Bat pattern is a precise harmonic pattern that I discovered in 2001. The Bat pattern is probably the most accurate pattern in the entire Harmonic Trading arsenal. The pattern possesses many distinct elements that define an excellent Potential Reversal Zone (PRZ). The pattern typically represents a deep retest of support or resistance that can frequently be quite sharp. Quick reversals from Bat pattern PRZs are quite common. In fact, valid reversals from Bat patterns frequently possess price action that is quite extreme. The pattern incorporates the powerful 0.886XA retracement, as the defining element in the Potential Reversal Zone (PRZ). The B point retracement must be less than a 0.618, preferably a 0.50 or 0.382 of the XA leg. The most ideal B point alignment is the 50% retracement of the XA leg. The B point is one of the primary ways to differentiate a Bat from a Gartley pattern. If a pattern is forming and the B point aligns at a 0.50 of the XA leg, it is likely to be a Bat. The Bat utilizes a BC projection that is at least 1.618. The BC projection can be as much as 2.618. However, the most ideal BC projections in a Bat pattern are a 1.618 or a 2.0. It is important to note that the BC projection must not be a 1.27, as anything less than a 1.618 BC projection invalidates the structure. Furthermore, the 1.27 BC projections are usually found in Gartley structures. The AB=CD pattern within the Bat distinguishes the structure, as well. This pattern is usually extended and ideally possesses a 1.27AB=CD calculation. However, the equivalent AB=CD pattern serves as a minimum requirement for any Bat to be a valid set-up. It is an incredibly accurate pattern and requires a smaller stop loss.
Schneider Electric Infrastructure Limited
No trades
Market insights

SCHNEIDER 1 Week Time Frame 📊 Current status
Last traded price: ~ ₹863 (shown on technical summary)
Technical rating (weekly timeframe): “Neutral” in many sources.
On shorter timeframes (daily), many indicators show bullish momentum.
🧮 Key support & resistance levels for the week
Based on available chart-analysis:
Support zone: around ₹810-₹830 region.
Resistance zone: around ₹900-₹915 region.
A pivot/resistance level near ~ ₹867-₹870 was noted for shorter term.
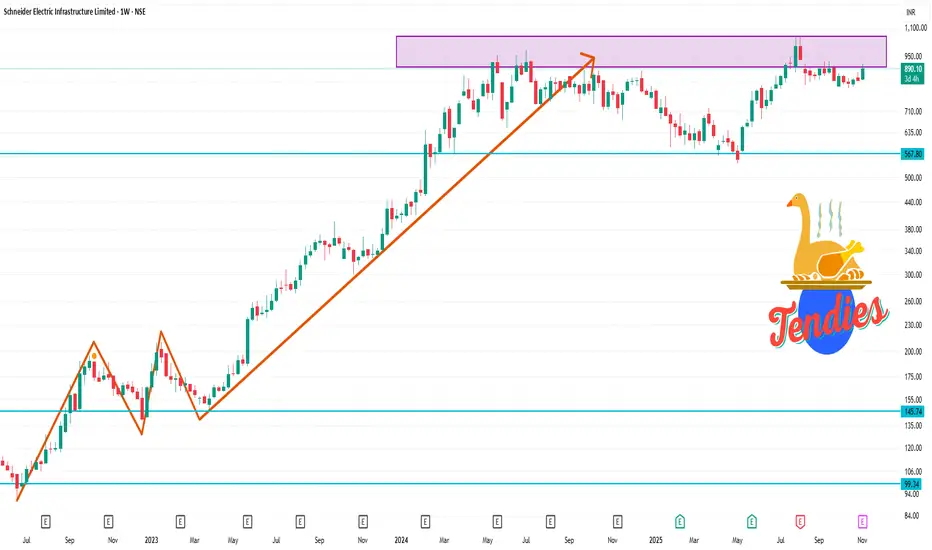
Schneider will go further up??As per harmonic PRZ pattern, Schneider can go further up till 1254, SL will be 654

Powering Ahead: Schneider InfraSchneider Electric Infrastructure Ltd. is a key player in India’s power distribution and automation space. As a subsidiary of the French multinational Schneider Electric SE, it delivers a range of products and solutions such as smart grid systems, transformers, switchgear, and digital substations. With India’s focus on modernizing infrastructure and developing smart cities, the company is well-positioned for structural long-term growth.
📈 Fundamental Analysis
Schneider has reported robust financial growth in recent years, supported by increased investments in infrastructure and digitization in the power sector.
Key Financial Highlights:
FY 2025 revenue rose to ₹26,367 Cr, up ~19.5% year-on-year.
Net profit for FY 2025 stood at ₹268 Cr, up from ₹172 Cr in FY 2024.
Q4 FY25 PAT came in at ₹55 Cr, registering a huge YoY jump, but a ~50% drop sequentially.
Operating margins remained healthy with an EBITDA margin of ~15.4%.
Valuation and Efficiency:
P/E ratio ranges between 85x–94x, far higher than sector averages, signaling overvaluation.
P/B ratio is steep at ~40x, reflecting investor optimism.
Strong return metrics: ROE at ~62.4% and ROCE at ~31.7%.
The company does not pay dividends, reinvesting all profits into operations and growth.
Recent Developments:
Schneider Electric SE will acquire the remaining 35% stake in the Indian subsidiary in a €5.5 billion all-cash deal.
This full ownership signals the parent’s long-term commitment to India as a strategic hub and may bring faster decision-making and capital allocation.
Risks to Monitor:
Valuations appear stretched; intrinsic value estimates range between ₹266 and ₹539, while the stock trades above ₹1,000.
Any decline in profitability or margin compression could lead to a rapid re-rating.
No dividend yield; returns are purely based on capital appreciation.
Technical Analysis
The technical setup for Schneider Electric Infra is strong across both the monthly and daily timeframes, confirming bullish momentum and breakout strength.
Monthly Timeframe Insights:
The stock closed at ₹1,002.90 in July with a powerful bullish engulfing candle, confirming a breakout above its all-time high resistance zone of ₹921–₹980.
Price has now cleared the crucial “close above ₹1,051” level that previously acted as a cap on rallies.
Major upside targets are visible at:
₹1,300 (R1)
₹1,615 (R2)
₹2,025 (R3)
Key support/reversal zone lies between ₹715 and ₹819, offering a strong base for accumulation.
Volume expansion confirms institutional participation in the breakout.
Daily Timeframe Observations:
A well-formed rounding base has completed, with the breakout triggered on rising volume and strong momentum.
Previous supply zone near ₹1,000 has been decisively converted into a support level.
The short-term trend is bullish with higher highs and higher lows continuing since May 2025.
Disclaimer: lnkd.in

SCHNEIDERFPotential Breakout from Base with Defined Stop-Loss
The daily chart for SCHNEIDER ELECTRIC INFRA (SCHNEIDERF) shows interesting price action, suggesting a potential breakout from a prolonged consolidation phase.
Key Observations & Technical Breakdown:
Base Formation: The stock has been trading within a well-defined consolidation "base" for several months (indicated by the black rectangle on the chart). This base typically represents a period of accumulation or distribution, and a breakout from such a pattern can signal a new trend.
Recent Upward Movement: The price has recently moved significantly higher, breaking above the upper boundary of this base. This breakout is a bullish signal, indicating that buyers have overcome the supply within this range.
Volume Activity: While not explicitly called out, it's prudent to observe the volume accompanying this breakout. Strong volume on the breakout candle would add conviction to the move.
Relative Strength: The relative strength line (bottom panel) can provide further insight into whether the stock is outperforming or underperforming the broader market. An improving relative strength would be an additional bullish confirmation.
Trading Strategy & Recommendation:
Entry: The current price action suggests that an entry could be considered after the breakout from the base.
Stop-Loss (SL): A critical aspect of this trade is the clearly defined "Stop Loss" level. As marked on the chart, a stop-loss can be placed below the previous swing low or a significant support level within the breakout candle's range. A potential stop-loss level could be around the 700-710 INR mark, offering a clear risk management point if the breakout fails.
Potential Targets: With a successful breakout from a base, potential targets can be estimated using the depth of the base projected upwards from the breakout point, or by identifying previous resistance levels.
Rationale: The breakout from a long-term base pattern is a significant technical event that often precedes substantial upward price movement. The presence of a clearly defined stop-loss allows for controlled risk management.

Schneider Electric : Channel BreakoutSchneider Electric :
Channel Breakout done
Sustaining 790 levels might take this to 810 and 830

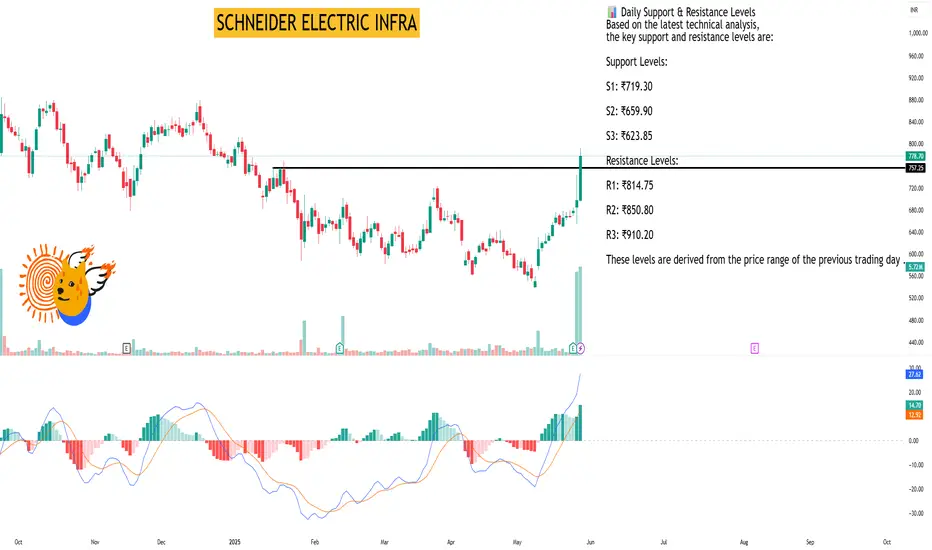
SCHNEIDER ELECTRIC INFRAAs of May 29, 2025, Schneider Electric Infrastructure Ltd. (NSE: SCHNEIDER) is trading at ₹778.70, reflecting an 11.57% increase over the past 24 hours .
📊 Daily Support & Resistance Levels
Based on the latest technical analysis, the key support and resistance levels are:
Support Levels:
S1: ₹719.30
S2: ₹659.90
S3: ₹623.85
Resistance Levels:
R1: ₹814.75
R2: ₹850.80
R3: ₹910.20
These levels are derived from the price range of the previous trading day .
🔍 Technical Indicators Overview
Relative Strength Index (RSI): 79.38 – Indicates overbought conditions.
MACD (12,26): 27.62 – Suggests bullish momentum.
ADX: 28.53 – Points to a strong trend.
Stochastic Oscillator: 90.63 – Suggests overbought territory.
Rate of Change (ROC): 25.57 – Indicates strong upward momentum.
Supertrend: 634.53 – Below current price, indicating bullish trend.
Parabolic SAR (PSAR): 646.47 – Below current price, supporting bullish sentiment.
These indicators collectively suggest a strong bullish trend for Schneider Electric Infrastructure Ltd. .
📈 Market Sentiment
The technical indicators collectively suggest a strong bullish sentiment for Schneider Electric Infrastructure Ltd. However, the RSI and Stochastic Oscillator indicate that the stock is in overbought territory, which may lead to a short-term correction. Investors should monitor the support and resistance levels closely for potential breakout or pullback scenarios.
Please note that stock market investments are subject to market risks, and it's essential to conduct thorough research or consult with a financial advisor before making investment decisions.
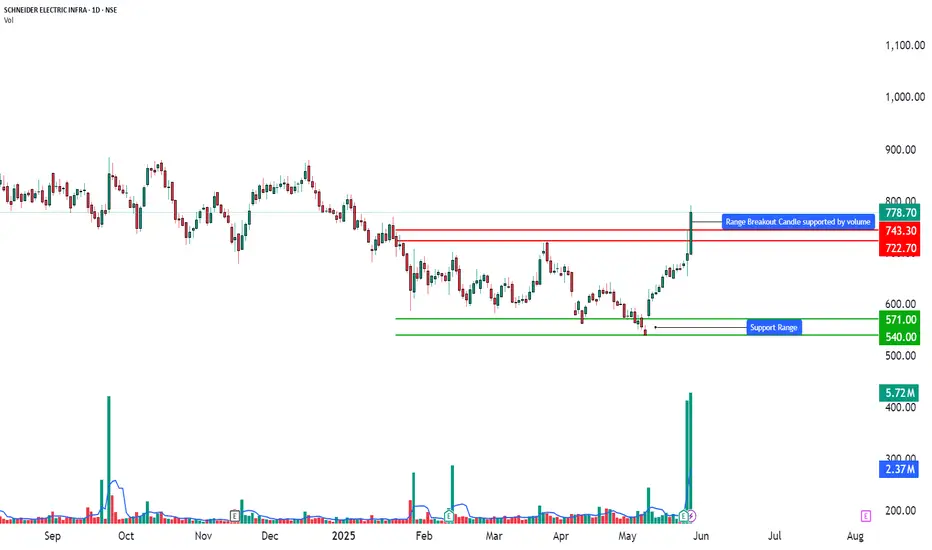
Technical Analysis - 52-Week Volume Breakout📈 SCHNEIDER ELECTRIC INFRA – TECHNICAL ANALYSIS
📆 Date: May 28, 2025
🔍 Timeframe: Daily
________________________________________
Price Action:
Schneider Electric Infra soared over 11.5% today with a strong bullish candle breaking above recent consolidation levels. This wide-range breakout candle marks a 20-day and 52-week volume breakout, indicating heavy accumulation and institutional participation. The price surged from support near ₹570 to close around ₹778.70, confirming bullish momentum.
________________________________________
Chart Pattern / Candlestick Pattern:
• Breakout Setup
• 52-Week High Breakout
• Bullish Candle with strong body and large volume
• BB Squeeze Breakout (Volatility Expansion Expected)
• Bollinger Band Expansion
• Volume Spike – highest in over a year
• Daily Chart: Bullish Initiation pattern on Heikin Ashi
• Weekly Chart: Bullish Continuation pattern formed
• Monthly Chart: Spinning Top, but with bullish undertones confirmed by volume
• Recent Candles: Long White Candle patterns on daily and monthly charts (May 28, 2025)
________________________________________
Technical Indicators:
• RSI (Daily): 79 – Strong bullish territory
• MACD: Bullish crossover active
• Stochastic: 95 – Overbought but shows strong momentum
• CCI: 188 – Momentum phase, institutional buying signs
• Volume: 5.72M – Extremely high, 20-day volume breakout
________________________________________
Support & Resistance Levels:
• Immediate Resistance: ₹814.75
• Next Resistance: ₹850.80
• Major Resistance: ₹910.20
• Immediate Support: ₹719.30
• Secondary Support: ₹659.90
• Major Support: ₹623.85
• Weak Support Zone: ₹570–₹550
________________________________________
Chart Overview:
The chart highlights:
🔸 Strong bullish candle piercing prior resistance
🔸 Volume breakout aligned with price breakout
🔸 Clear resistance cluster above ₹814–₹910
🔸 Support zone well established below ₹720
🔸 Multiple confirmations from indicators and volume surge
🔸 Entry was marked at ₹791.40 with SL at ₹651.85
________________________________________
Educational Breakdown:
This is a textbook breakout with volume confirmation setup:
• Price Action: Breakout from resistance zone
• Momentum Indicators: Strongly aligned
• Volume: Institutional spike with confirmation of trend continuation
• Band Expansion: Signals beginning of high volatility trend
• Entry Confirmation: RSI + BB + Volume breakout + Trend indicators
This setup indicates a fresh trend beginning post-accumulation phase, making it suitable for swing to positional trades. The aggressive rise also suggests short-term profit-taking zones near the immediate resistance, while medium-term targets remain valid.
________________________________________
How to Trade Schneider Electric Infra (for learning purpose):
• Entry Example: ₹791.40
• Stop Loss: ₹651.85 (Risk: ₹139.55)
• Target 1: ₹930.95 (Reward: ₹139.55)
• Target 2: ₹1070.45 (Reward: ₹279.05)
• Sample Quantity: 50 shares
• RR Ratio: 1:1 to 1:2
• Aggressive Traders: Can ride trend with trailing stop
• Conservative Traders: Wait for pullback near ₹720–₹700 before entry
⚠️ Risk Management Tip: Always trade with a clearly defined stop loss. Avoid entering positions impulsively. It is advisable to start with a smaller quantity and increase your exposure only if the price action confirms the continuation of the trend. Capital protection should always be the priority.
📢 Disclaimer
This content is created purely for educational and informational purposes. It is not intended as investment advice, stock recommendations, or trading tips. Trading and investing in the stock market involves risk. Please consult with a SEBI-registered financial advisor before making any investment decisions. The author/creator is not registered with SEBI and shall not be held responsible for any losses incurred based on this information. Always do your own research and use proper risk management.
👉 If you found this analysis helpful, don’t forget to Follow, so you never miss out on a trade-worthy setup, breakout opportunity, or valuable educational insight again. Stay updated and trade smarter! 💡📈
Schneider Electric Infrastructure Ltd.#schneider double bottom pattern formed
target - 800 £
entry - 630 £
stop loss - 590 £
time frame - 2 months
technicals - bullish
this is not any financial advise

Short term trading opportunity in SCHNEIDER for > 15% upsideHi,
NSE:SCHNEIDER has given a Bullish On-Neck Breakout on Daily charts with very good volume.
MACD is also on the bullish side on Weekly time frames. RSI is also on the bullish side on daily, weekly and monthly time frames.
In the current market scenario, I am expecting that the bullish momentum will continue.
Complete price projection like entry, stop loss and targets mentioned on the charts for educational purpose.
Don't Forget to Follow me to get all the updates.
Please share your feedback or any queries on the study.
Disclaimer: Please consult your financial advisor before making any investment decision.

Tringle Formation If Sustains above ₹855 another 4 to 5 days, Good Chance of Risk Reward 1:1.
Disclaimer: Consult Your Before Taking Trade, It's here is Purely Educational Purpose

SCHNEIDER is in the Daily Demand ZoneSCHNEIDER is in the Daily Demand Zone, there is a chance of this demand zone to not sustain as the supply zone above is near, and the overall market sentiment is negative

Ready For Cup & Handle Breakout With High Momentum -After breakout schneider gave excellent rally and formed cup & handle pattern
-now trading near 52 week high and weak resistance zone which it should break easily
-Macd & Adx showing strong momentum
-Stock trading above all major ema & Sma it will break the pattern and will give good rally once again keep in radar

SCHNEIDER ELECTRIC--BOX BREAK OUTAll the information given in the chart is for the educational purpose only.
~Do your own research before investing.
~This is not my recommendation.
~My recommendation--LEARN MORE EARN MORE.


Schneider Electric Infrastructure - Long Setup, Move is ON...#SCHNEIDER trading above Resistance of 538
Next Resistance is at 722
Support is at 355
Here are previous charts:
Chart is self explanatory. Levels of breakout, possible up-moves (where stock may find resistances) and support (close below which, setup will be invalidated) are clearly defined.
Disclaimer: This is for demonstration and educational purpose only. This is not buying or selling recommendations. I am not SEBI registered. Please consult your financial advisor before taking any trade.

Schneider Electric Infrastructure - Long Setup, Move is ON...#SCHNEIDER trading above Resistance of 355
Next Resistance is at 538
Support is at 202
Here are previous charts:
Chart is self explanatory. Entry, Resistances and Support are mentioned on the chart.
Disclaimer: This is for demonstration and educational purpose only. This is not buying or selling recommendations. I am not SEBI registered. Please consult your financial advisor before taking any trade.


Schneider Electric Infrastructure Ltd - Turnaround Stock #Schneider
CMP : ₹.436/-
Date : 12-01-2024
Schneider Electric Infrastructure Ltd is engaged in the manufacturing and designing of advanced products and systems of electricity network business. A high risk company in terms of fundamental parameters. A high debt company with declining net cash flow , poor sales growth , increasing debtor days , inventory cycle period etc. But technically it's looking very good. A turnaround performance has seen in the movement of this stock from 2021 and which was boosted by government's push towards the power sector . Stock has given a stellar return in 2021 & 2022 . This bullish mode will be continued. A breakout in the round bottom pattern which have an age of more than 10 years have been identified in the charts. The stock is near its more than 1year long resistance trend line. If the volume supports and it breaks the trend line, then have a possibility to move towards ₹.1000. Stoploss below ₹.410 level.
Disclaimer : Post only for educational purpose. Not a buying / selling recommendation. This is only my personal view. I am not a SEBI registered analyst . Do your own analysis and act accordingly

Move 10% or more - Schneider Breakout of w pattern after consolidation.
Spike in the volume on daily candle.

Schneider electric The stock after breaking out into life time territory. Has pulled back, the stock after crossing avwap n poc is likely to continue its upward journey.

Schneider Electric is ready to give electric shockchart is self explanatory, a long term downward slopping channel breakout is confirmed about 95, and stock is maintaining those higly strongl with good volumes. with is W pattern almost on the verge of the breakout Target can 35-50% from here.
Just buy and wait patiently..
Disclosure :- I own this @ 102 rs.

schneiderthe stock has made ascending triangle pattern on 15 min chart makin higher low that sign of strength if break resistance it will go up
NOTE: not a call only for educational purpose
