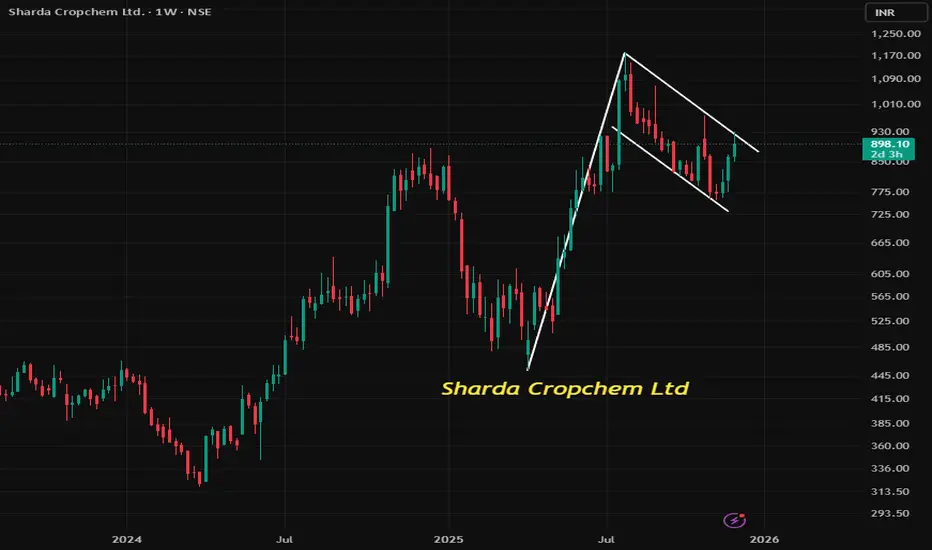
SHARDA CROPCHEM : The Flag & Pole patternThe Flag & Pole pattern is a powerful bullish continuation setup. In Sharda Cropchem Ltd, currently trading at ₹901, this pattern suggests potential upside if the breakout sustains, with defined target and stop-loss levels.
📈 What is a Flag & Pole Pattern?
1. Pole: A sharp, vertical price rise driv
Next report date
—
Report period
—
EPS estimate
—
Revenue estimate
—
50.10 INR
3.04 B INR
43.17 B INR
22.72 M
About Sharda Cropchem Ltd.
Sector
Industry
CEO
Ramprakash Vilasrai Bubna
Website
Headquarters
Mumbai
Founded
2004
ISIN
INE221J01015
FIGI
BBG0072BS6Z5
Sharda Cropchem Ltd. is a holding company, which engages in the marketing and distribution of formulations and generic active ingredients. It operates through the Agrochemicals and Belts segments. The Agrochemicals segment trades agrochemical products including insecticides, herbicides, fungicides, and biocides. The Belts segment is involved in trading of products such as conveyor belts and rubber belts/sheets. The company was founded by Ramprakash Vilasrai Bubna, Sharda Ramprakash Bubna, Ashish Ramamurthy Bubna, and Manish Ramprakash Bubna on March 12, 2004 and is headquartered in Mumbai, India.
Related stocks
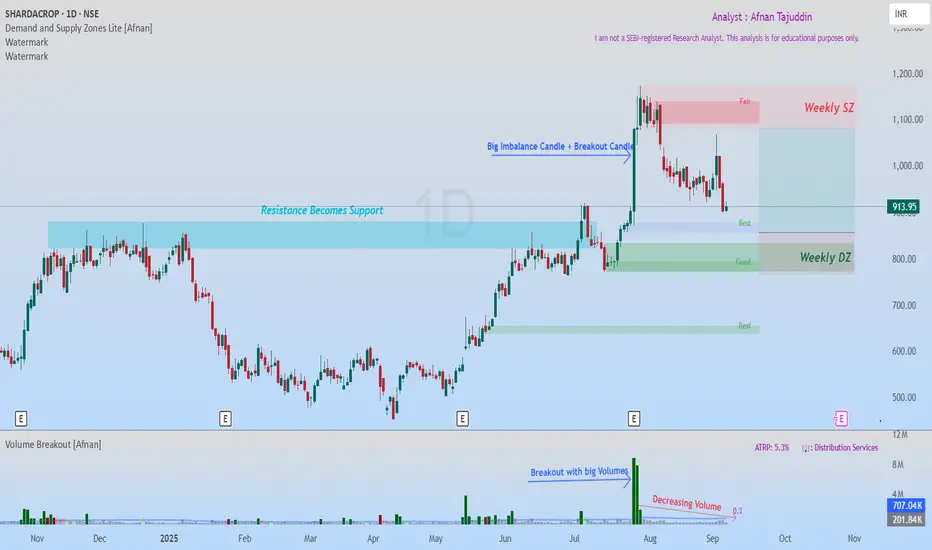
SHARDACROP: Smart Money Demand Zones Align with Classic BreakoutI've been tracking SHARDACROP, and what I'm seeing is honestly one of those setups that doesn't come around too often. There's something brewing here that caught my attention—and it's not just one signal, but two completely different analytical approaches pointing to the exact same conclusion.
Toda
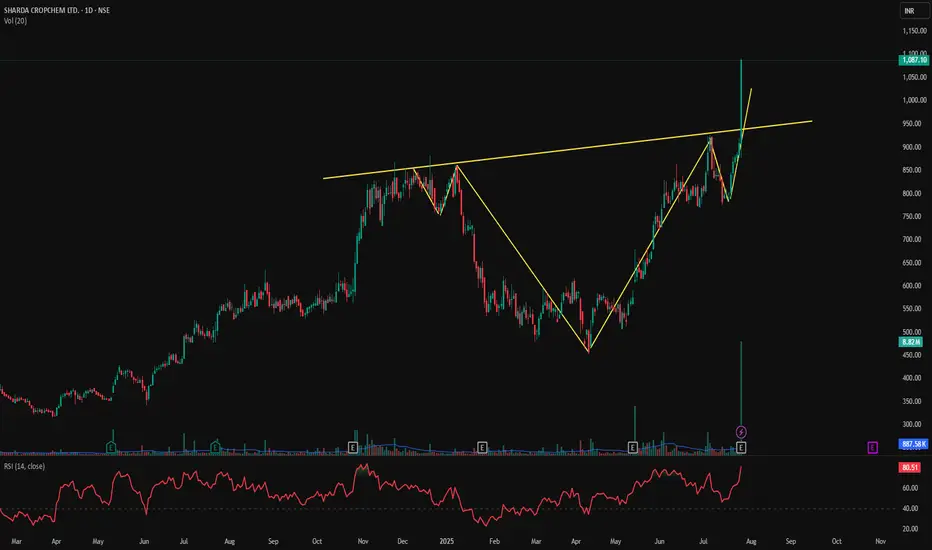
SHARDACROP – Cup & Handle Breakout with Explosive Volume📊 SHARDACROP – Cup & Handle Breakout with Explosive Volume | RSI > 80
📅 Chart Date: July 26, 2025
📍 CMP: ₹1,087.10 (+19.63%)
📈 Symbol: NSE:SHARDACROP | 1D Timeframe
🔍 Technical Analysis Breakdown
☕ Cup and Handle Breakout
A clear Cup and Handle formation has completed.
Breakout above the neckline (
BUY TODAY SELL TOMORROW for 5% DON’T HAVE TIME TO MANAGE YOUR TRADES?
- Take BTST trades at 3:25 pm every day
- Try to exit by taking 4-7% profit of each trade
- SL can also be maintained as closing below the low of the breakout candle
Now, why do I prefer BTST over swing trades? The primary reason is that I have observed t

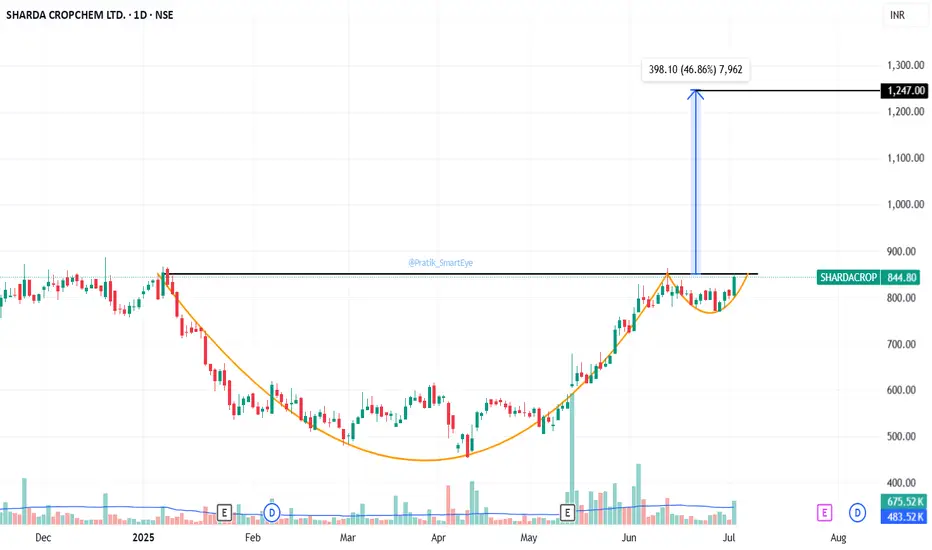
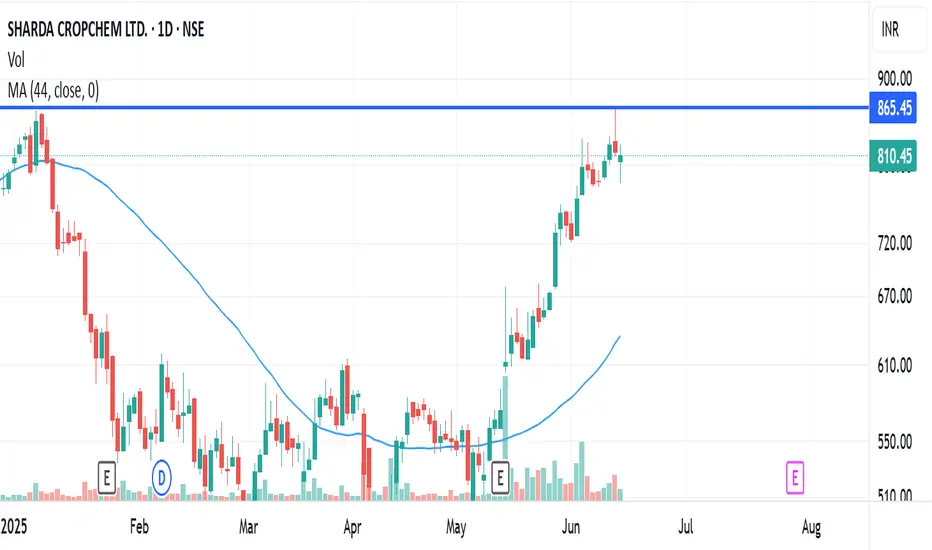
Sharda Cropchem: Breakout with C&HSharda Cropchem: Breakout with Cup & Handle Pattern at 850. CMP 844.
SHARDA CROP CHEM can be shortedStock has tested the resistance and seems should be testing the support levels now.
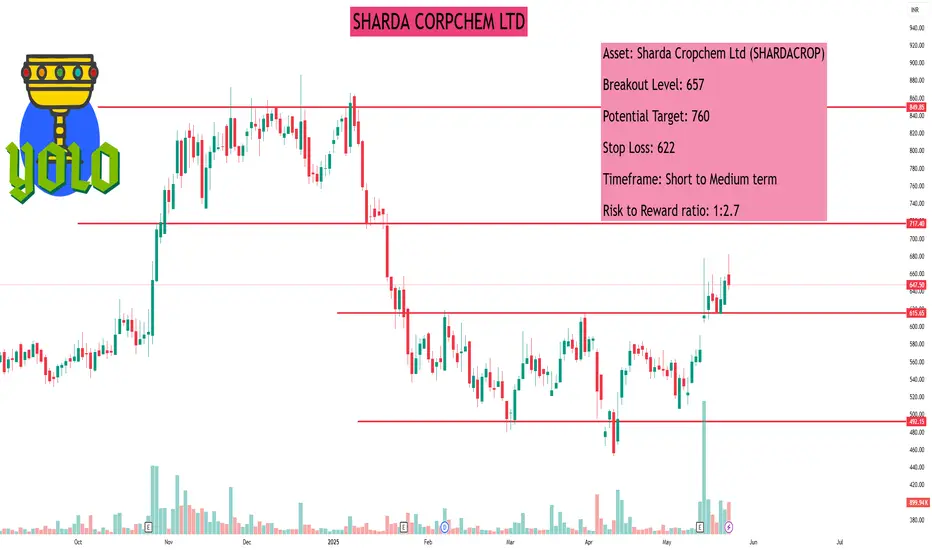
#SHARDACROPAsset: Sharda Cropchem Ltd (SHARDACROP)
Breakout Level: 657
Potential Target: 760
Stop Loss: 622
Timeframe: Short to Medium term
Risk to Reward ratio : 1:2.7
Rationale:
Fundamentals -
Fundamentally decent stock with the following attributes:
* ROCE - 19.3%
* ROE - 12.8%
* Debt to Equity - 0
* Stoc
SHARDA CROPCHEM LTD.SHARDA CROPCHEM LTD.
#SHARDACROP
Asset: Sharda Cropchem Ltd (SHARDACROP)
Breakout Level: 657
Potential Target: 760
Stop Loss: 622
Timeframe: Short to Medium term
Risk to Reward ratio: 1:2.7
Rationale:
Fundamentals-
Fundamentally decent stock with the following attributes:
* ROCE - 19.3%
* ROE - 1
#SHARDACROP ltd
#SHARDACROP is taking support from its previous consolidation zone.
today good green candle with volume showing it may move up in next few sessions.
Sharda Cropchem Limited is an Indian company specializing in the marketing and distribution of a wide range of agrochemicals, including formulations

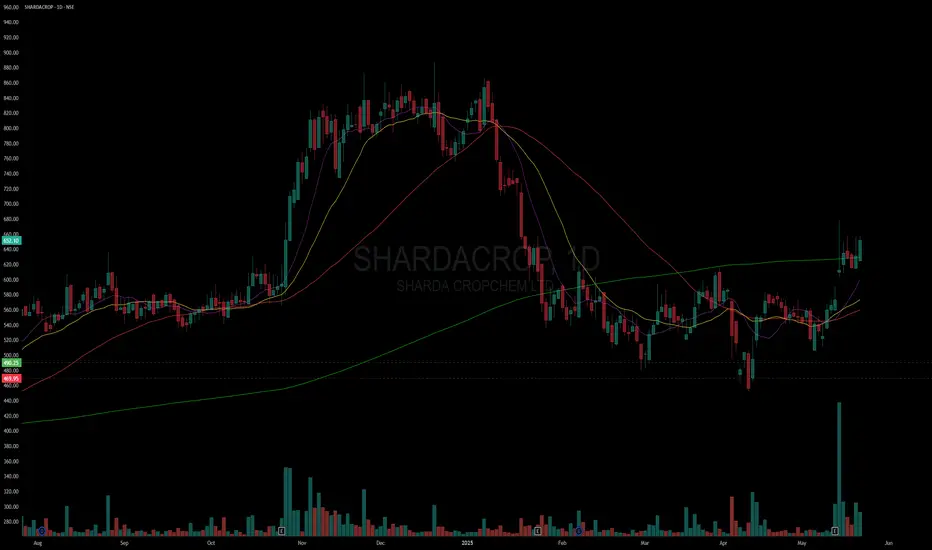
shardacrop reversing from supportshardacrop is taking support from its previous consolidation zone.
today good green candle with volume showing it may move up in next few sessions

See all ideas
Summarizing what the indicators are suggesting.
Neutral
SellBuy
Strong sellStrong buy
Strong sellSellNeutralBuyStrong buy
Neutral
SellBuy
Strong sellStrong buy
Strong sellSellNeutralBuyStrong buy
Neutral
SellBuy
Strong sellStrong buy
Strong sellSellNeutralBuyStrong buy
An aggregate view of professional's ratings.
Neutral
SellBuy
Strong sellStrong buy
Strong sellSellNeutralBuyStrong buy
Neutral
SellBuy
Strong sellStrong buy
Strong sellSellNeutralBuyStrong buy
Neutral
SellBuy
Strong sellStrong buy
Strong sellSellNeutralBuyStrong buy
Displays a symbol's price movements over previous years to identify recurring trends.
EPI
WisdomTree India Earnings FundWeight
0.02%
Market value
407.57 K
USD
DGS
WisdomTree Emerging Markets SmallCap Dividend FundWeight
0.02%
Market value
261.05 K
USD
DGSE
WisdomTree Emerging Markets SmallCap Dividend UCITS ETFWeight
0.02%
Market value
8.52 K
USD
Explore more ETFs
Frequently Asked Questions
The current price of SHARDACROP is 891.40 INR — it has increased by 0.12% in the past 24 hours. Watch Sharda Cropchem Ltd. stock price performance more closely on the chart.
Depending on the exchange, the stock ticker may vary. For instance, on NSE exchange Sharda Cropchem Ltd. stocks are traded under the ticker SHARDACROP.
SHARDACROP stock has risen by 6.79% compared to the previous week, the month change is a 8.17% rise, over the last year Sharda Cropchem Ltd. has showed a 7.31% increase.
We've gathered analysts' opinions on Sharda Cropchem Ltd. future price: according to them, SHARDACROP price has a max estimate of 1,360.00 INR and a min estimate of 967.00 INR. Watch SHARDACROP chart and read a more detailed Sharda Cropchem Ltd. stock forecast: see what analysts think of Sharda Cropchem Ltd. and suggest that you do with its stocks.
SHARDACROP reached its all-time high on Jul 29, 2025 with the price of 1,181.00 INR, and its all-time low was 99.40 INR and was reached on Mar 23, 2020. View more price dynamics on SHARDACROP chart.
See other stocks reaching their highest and lowest prices.
See other stocks reaching their highest and lowest prices.
SHARDACROP stock is 3.98% volatile and has beta coefficient of 1.98. Track Sharda Cropchem Ltd. stock price on the chart and check out the list of the most volatile stocks — is Sharda Cropchem Ltd. there?
Today Sharda Cropchem Ltd. has the market capitalization of 79.95 B, it has increased by 8.92% over the last week.
Yes, you can track Sharda Cropchem Ltd. financials in yearly and quarterly reports right on TradingView.
Sharda Cropchem Ltd. is going to release the next earnings report on Jan 28, 2026. Keep track of upcoming events with our Earnings Calendar.
SHARDACROP net income for the last quarter is 743.14 M INR, while the quarter before that showed 1.43 B INR of net income which accounts for −47.95% change. Track more Sharda Cropchem Ltd. financial stats to get the full picture.
Sharda Cropchem Ltd. dividend yield was 1.58% in 2024, and payout ratio reached 26.68%. The year before the numbers were 0.93% and 84.89% correspondingly. See high-dividend stocks and find more opportunities for your portfolio.
As of Dec 5, 2025, the company has 197 employees. See our rating of the largest employees — is Sharda Cropchem Ltd. on this list?
EBITDA measures a company's operating performance, its growth signifies an improvement in the efficiency of a company. Sharda Cropchem Ltd. EBITDA is 7.40 B INR, and current EBITDA margin is 16.36%. See more stats in Sharda Cropchem Ltd. financial statements.
Like other stocks, SHARDACROP shares are traded on stock exchanges, e.g. Nasdaq, Nyse, Euronext, and the easiest way to buy them is through an online stock broker. To do this, you need to open an account and follow a broker's procedures, then start trading. You can trade Sharda Cropchem Ltd. stock right from TradingView charts — choose your broker and connect to your account.
Investing in stocks requires a comprehensive research: you should carefully study all the available data, e.g. company's financials, related news, and its technical analysis. So Sharda Cropchem Ltd. technincal analysis shows the buy rating today, and its 1 week rating is buy. Since market conditions are prone to changes, it's worth looking a bit further into the future — according to the 1 month rating Sharda Cropchem Ltd. stock shows the strong buy signal. See more of Sharda Cropchem Ltd. technicals for a more comprehensive analysis.
If you're still not sure, try looking for inspiration in our curated watchlists.
If you're still not sure, try looking for inspiration in our curated watchlists.