SHARDACROP: Smart Money Demand Zones Align with Classic BreakoutI've been tracking SHARDACROP, and what I'm seeing is honestly one of those setups that doesn't come around too often. There's something brewing here that caught my attention—and it's not just one signal, but two completely different analytical approaches pointing to the exact same conclusion.
Today, I'm breaking down this chart using the modern supply & demand approach that tracks institutional footprints, and the classic technical analysis. When these two methodologies start singing the same tune? That's when you know it's time to pay attention.
What makes this SHARDACROP setup special? Both methods are screaming the same message. And in my experience, that's usually when the big moves happen.
💡 Supply & Demand Analysis - Reading the Smart Money Trail 💡
Let's start with the supply and demand zones. Think of these as crime scenes—they're where the big players left their fingerprints. These aren't random levels; they're areas where massive institutional orders are sitting, waiting to be filled.
🎯 How the Big Players Play 🎯
Here's what most retail traders don't get: when institutions want to buy or sell millions of dollars worth of stock, they can't just hit the market buy button like we do. They'd move the price against themselves instantly. Instead, they layer in orders over time, creating these demand and supply zones.
So when price comes back to test a demand zone, we're betting that the same smart money players who were buying there before still have unfilled orders waiting. It's like they've set a trap—and price is walking right into it.
🔥 What Jumped Out at Me with SHARDACROP 🔥
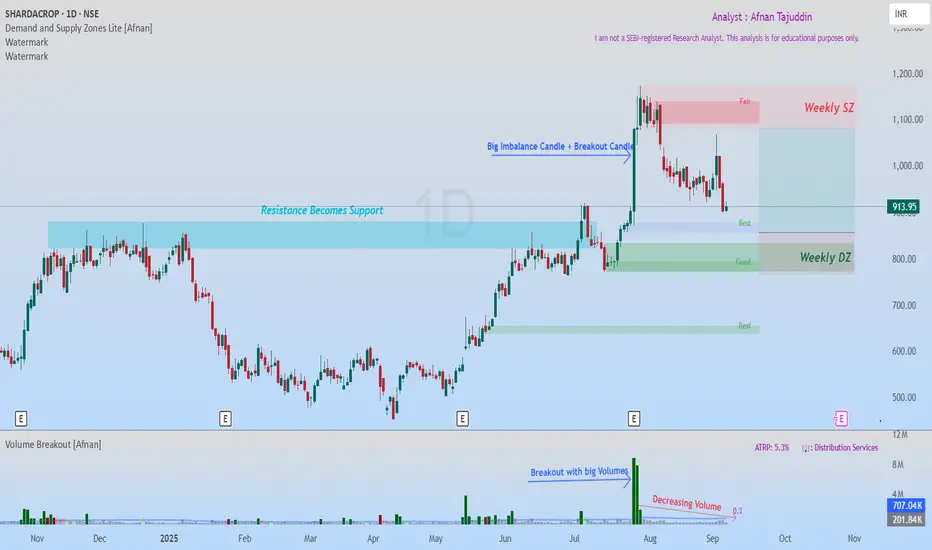
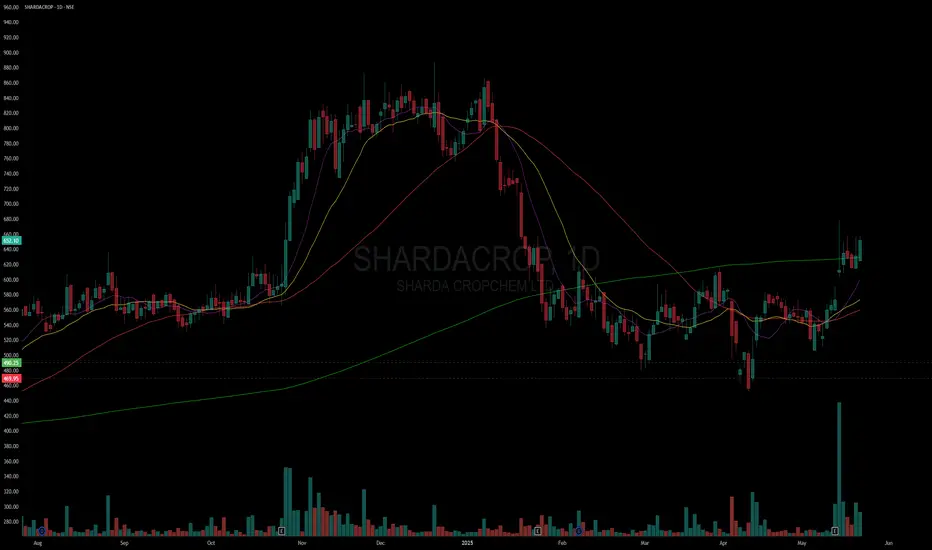
Solid Weekly Foundation : There's a weekly demand zone that's been acting like a fortress
Stacked Daily Zones : Inside that weekly zone, we've got 1 daily demand zone and another demand zone is latest layered on top of each other.
Leg-out Candle Signature : That leg-out candle? Breaking to new highs, Pure smart money. The size of that imbalance tells me this wasn't retail traders getting excited
📈 The Setup That's Unfolding 📈
Now here's where it gets interesting. Price is drifting back toward our demand zone, and everything's lining up perfectly:
Entry Sweet Spot : Right within that established demand zone
Clean Risk Level : Stop goes below the zone—simple
Clear Target Path : Measured move up to the next supply zone
What I love about this risk-reward setup is the clean path to our 1:2.5 target. There's no major supply zone standing in our way, and the weekly trend is up.
⚡ Traditional Technical Analysis ⚡
Now let's flip the script and look at this through classic technical analysis. And you know what? The story gets even better.
🏗️ The Resistance That Finally Cracked 🏗️
This chart's telling a story I've seen a thousand times, but it never gets old:
The Struggle Phase : Price kept banging its head against the same resistance level, over and over
The Explosion : When it finally broke, it didn't just break—it demolished that level with a massive candle and huge volume
Volume Don't Lie : That breakout volume spike? That's confirmation the move was real
The Polarity Play : Now that old resistance is getting ready to flip into support—textbook price action
📊 Volume Tells the Real Story 📊
What really caught my eye is how volume's behaving on this pullback. As price drifts down toward our support zone, volume's drying up. That's not weakness—that's actually bullish. It means the selling pressure is fading, and when volume contracts like this during a retest, it often sets the stage for the next leg higher.
🎯 When Two Worlds Collide - The Confluence Magic 🎯
Here's where things get really exciting. I'm not just seeing one good setup—I'm seeing two completely different analytical methods pointing to the exact same opportunity:
Supply & Demand Says : Smart money demand zone with layered institutional support
Technical Analysis Says : Classic breakout retest with polarity support and volume confirmation
The Bottom Line : Both methods identify the same zone as the high-probability entry point
When this happens, I call it a "confluence setup." It's like having two different GPS systems both telling you to take the same route—you can be pretty confident you're heading in the right direction.
🌟 Putting It All Together 🌟
SHARDACROP's showing me: institutional footprints perfectly aligned with classic technical patterns. The Multiple Timeframe demand zones, the breakout retest setup, the volume behavior—it's all coming together in a way that makes me sit up and take notice.
But remember, even the best setups can fail. The market doesn't owe us anything, and it certainly doesn't care how confident we are. Trade smart, manage risk, and let the probabilities work in your favor over time.
💪 "The best traders aren't the ones who are right the most—they're the ones who make the most when they're right and lose the least when they're wrong." 📈
Disclaimer: This analysis is purely for educational purposes and isn't meant as trading or investment advice. I'm not a SEBI registered analyst. Always consult with qualified financial advisors before making investment decisions.
SHARDACROP trade ideas
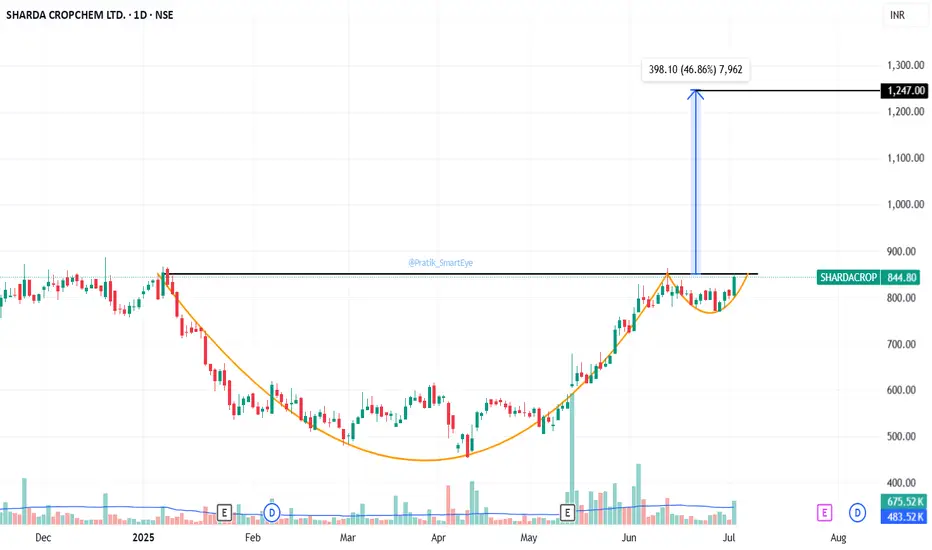
SHARDACROP – Cup & Handle Breakout with Explosive Volume📊 SHARDACROP – Cup & Handle Breakout with Explosive Volume | RSI > 80
📅 Chart Date: July 26, 2025
📍 CMP: ₹1,087.10 (+19.63%)
📈 Symbol: NSE:SHARDACROP | 1D Timeframe
🔍 Technical Analysis Breakdown
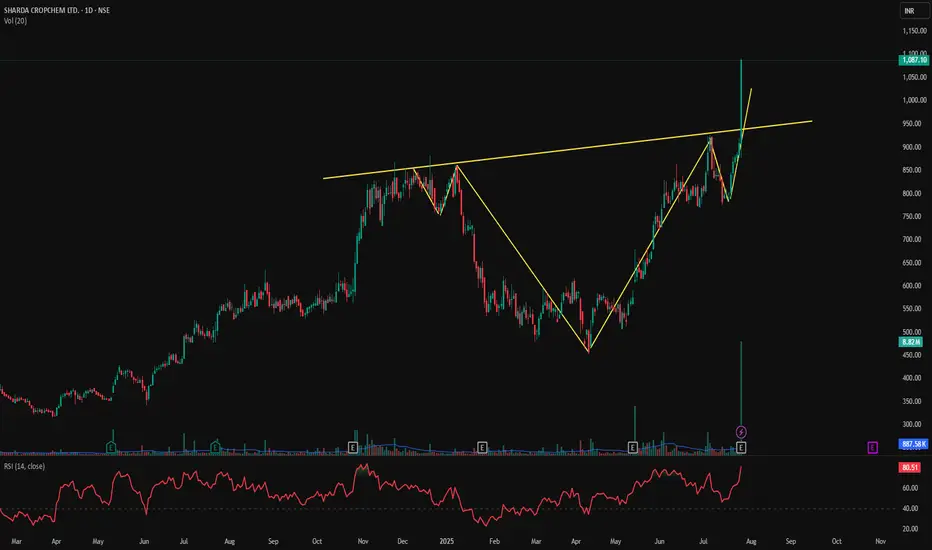
☕ Cup and Handle Breakout
A clear Cup and Handle formation has completed.
Breakout above the neckline (~₹940) with a massive bullish candle.
💥 Volume Spike
Volume surged to 8.82M, against the 20-day average of ~887K — institutional buying visible.
This is the highest volume in months, confirming the breakout strength.
📈 RSI (14, close): 80.51
Momentum is extremely strong, entering the overbought zone — may signal continuation or short-term pullback before resuming rally.
📌 Breakout Level: ₹940
📌 Immediate Resistance: ₹1,100–₹1,150
📌 Support on Retest: ₹940–₹960
🎯 Trade Setup
Entry on Retest: ₹960–₹980
Stoploss: ₹920 (below handle base)
Target: ₹1,150 / ₹1,200+
Risk Level: Moderate–High (due to RSI overbought, but pattern is strong)
⚠️ Disclaimer: This is an educational chart setup and not trading advice. Please conduct your own research and risk management.
📣 Follow @PriceAction_Pulse for more such clean breakouts and chart pattern analysis!
🔁 Drop a comment if SHARDACROP is on your radar for the next breakout rally 📈
BUY TODAY SELL TOMORROW for 5% DON’T HAVE TIME TO MANAGE YOUR TRADES?
- Take BTST trades at 3:25 pm every day
- Try to exit by taking 4-7% profit of each trade
- SL can also be maintained as closing below the low of the breakout candle
Now, why do I prefer BTST over swing trades? The primary reason is that I have observed that 90% of the stocks give most of the movement in just 1-2 days and the rest of the time they either consolidate or fall
Trendline Breakout in SHARDACROP
BUY TODAY SELL TOMORROW for 5%

Sharda Cropchem: Breakout with C&HSharda Cropchem: Breakout with Cup & Handle Pattern at 850. CMP 844.
SHARDA CROP CHEM can be shortedStock has tested the resistance and seems should be testing the support levels now.
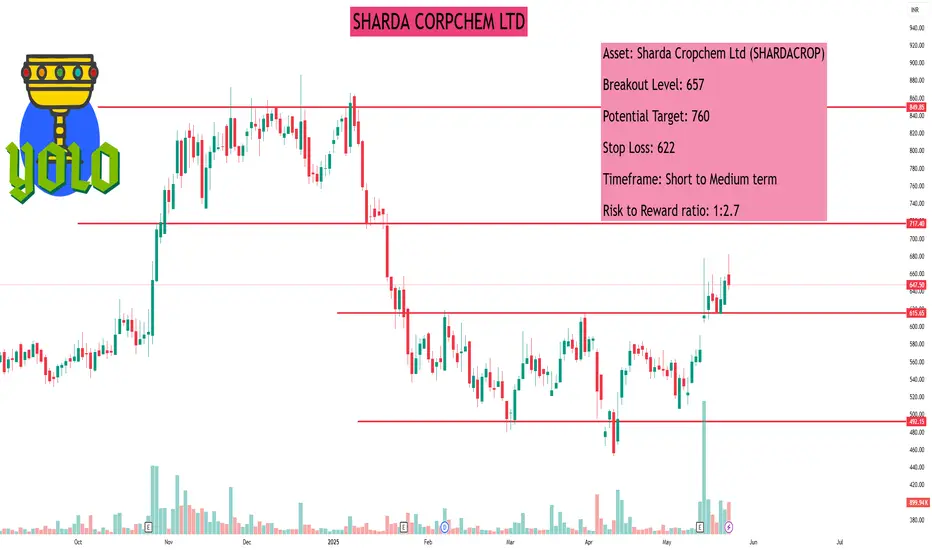
#SHARDACROPAsset: Sharda Cropchem Ltd (SHARDACROP)
Breakout Level: 657
Potential Target: 760
Stop Loss: 622
Timeframe: Short to Medium term
Risk to Reward ratio : 1:2.7
Rationale:
Fundamentals -
Fundamentally decent stock with the following attributes:
* ROCE - 19.3%
* ROE - 12.8%
* Debt to Equity - 0
* Stock PE 19.3 / Industry PE - 29.5 || Stock PBV 2.35 / Industry PBV 2.5 - Company is underpriced
* EPS / Revenue - Increasing over last 6 months
Technicals -
* Overall structure - Forming a large cup on weekly charts
* Multiple timeframe analysis - Stock poised for up move as the daily / weekly / monthly charts are showing formation of a cup (over 5 months)
* On daily charts, the price surged ~3.3% yesterday and surfing the 200 DMA
* The 10 DMA is above the 20 DMA and hints towards continued up move
* Increasing momentum / RS
* ADR 5.5%
Market analysis
* Forecasted for ~33% further increase
* Promoter holding high at 74.82% and remains steady
* FIIs increasing holding
* MFs and DIIs are increasing stake
* Retail reducing
Cons
* Considering that the price has gapped up, there could be some pull back but overall structure of the 200 DMA line remains up
This analysis is for educational purposes only and should not be considered as financial advice. Trading and investing in financial markets involve significant risk, and past performance is not indicative of future results. You should conduct your own research and consult with a qualified financial advisor before making any trading or investment decisions. The author is not responsible for any financial losses or damages that may result from the use of this information.
SHARDA CROPCHEM LTD.SHARDA CROPCHEM LTD.
#SHARDACROP
Asset: Sharda Cropchem Ltd (SHARDACROP)
Breakout Level: 657
Potential Target: 760
Stop Loss: 622
Timeframe: Short to Medium term
Risk to Reward ratio: 1:2.7
Rationale:
Fundamentals-
Fundamentally decent stock with the following attributes:
* ROCE - 19.3%
* ROE - 12.8%
* Debt to Equity - 0
* Stock PE 19.3 / Industry PE - 29.5 || Stock PBV 2.35 / Industry PBV 2.5- Company is underpriced
* EPS / Revenue - Increasing over last 6 months
Technicals -
* Overall structure - Forming a large cup on weekly charts
* Multiple timeframe analysis - Stock poised for up move as the daily/weekly/ monthly charts are showing formation of a cup (over 5 months)
* On daily charts, the price surged ~3.3% yesterday and surfing the 200 DMA
* The 10 DMA is above the 20 DMA and hints towards continued up move
* Increasing momentum / RS
* ADR 5.5%
Market analysis
* Forecasted for ~33% further increase
* Promoter holding high at 74.82% and remains steady
* Fils increasing holding
*MFs and Dils are increasing stake
* Retail reducing
Cons
* Considering that the price has gapped up, there could be some pull back but overall structure of the 200 DMA line remains up
This analysis is for educational purposes only and should not be considered as financial advice. Trading and investing in financial markets involve significant risk, and past performance is not indicative of future results. You should conduct your own research and consult with a qualified financial advisor before making any trading or investment decisions. The author is not responsible for any financial losses or damages that may result from the use of this information.
#SHARDACROP ltd
#SHARDACROP is taking support from its previous consolidation zone.
today good green candle with volume showing it may move up in next few sessions.
Sharda Cropchem Limited is an Indian company specializing in the marketing and distribution of a wide range of agrochemicals, including formulations and generic active ingredients. Their core competencies encompass identifying generic molecules, preparing dossiers, obtaining registrations, and distributing products in the fungicide, herbicide, and insecticide segments.
SHARDACROPCHEM.COM
In addition to agrochemicals, Sharda Cropchem supplies various conveyor belts, V-belts, and industrial chemicals. These products are primarily utilized in mining projects, steel plants, quarries, grain silos, cement manufacturing facilities, ports, and tunneling projects. The company serves markets across Europe, NAFTA, Latin America, and other regions worldwide.

shardacrop reversing from supportshardacrop is taking support from its previous consolidation zone.
today good green candle with volume showing it may move up in next few sessions

SHARDACROP: Breakout Alert!
From our Previous entry( which I posted here) Stock clocked 23%. Now it is:
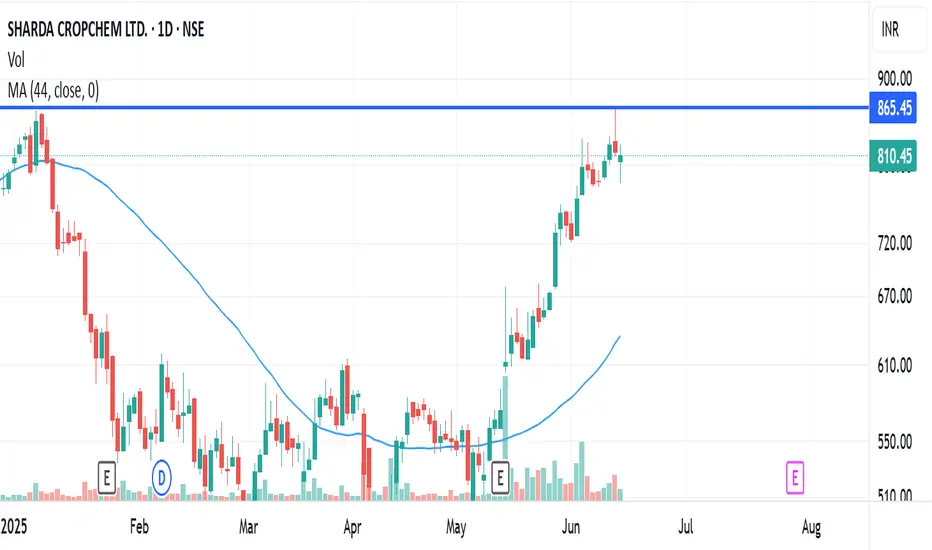
✅ Consolidation Above Breakout Zone: Healthy consolidation near ₹879, indicating strength and accumulation.
✅Base on Base Formation
✅ Volume Confirmation: Significant volume during the breakout phase, validating bullish sentiment.
✅ Support from Moving Averages: Price trading above the 50 and 200 DMAs, confirming a bullish bias.
🎯 Key Levels:
Entry Zone: ₹-879-880
Medium-Term Target: ₹1,050-1,100
Stop Loss: ₹773 (Closing Basis)
💡 Risk/Reward:
Risk: ~11.8%
Reward: ~20%-22%
📌 Note: Always maintain proper risk management and conduct your own research before taking any position.

Positional Trade Sharda Cropchem
Trade details mentioned in the chart
Yellow Lines = Add on dips
Red Line = SL CLB
Green Lines = Targets
TSL Must = to maximize profits & lower your risk
Don't miss to Boost 🚀 this idea
For more info - Plz visit my profile
Follow me for more.....
Rgds,
Naresh G
SEBI Reg.RA

SHARDACROP & DBCORP: Two Bright Spots in a Challenging MarketSharda Cropchem
● The stock price is evidently experiencing a robust upward trend.
● After a brief consolidation phase, it developed a Rounding Bottom pattern, and following a breakout, it has surged to an all-time high.
● The increasing buying volume suggests that the stock could continue to rise significantly.
D.B. Corp
● The stock price is currently moving within an Ascending Parallel channel.
● After reaching an all-time high around the 404 mark, the stock experienced a pullback to its trendline support level.
● Having rebounded from this support, the stock price is now poised for upward movement.

Sharda Cropchem for 60% gainsDate: 11 Nov’24
Symbol: SHARDACROP
Timeframe: Daily
Sharda Cropchem seems to be in Wave III of 3 which is heading towards 1350 (~60% from current price of 800) as seen in the chart. Wave 3 could even extend to 1500 which can be reviewed after closing above 1100 in Wave V of 3. Recent Q2 results are good with better margins compared to last FY.
This is not a trade recommendation. Please do your own analysis. And I have the right to be wrong.
HINGLISH VERSION
Jaisa ki chart mein dekha gaya hai, Sharda Cropchem 3 ke Wave III mein dikh raha hai jo 1350 (800 ki maujooda keemat se ~60%) ki taraf badh raha hai. Wave 3 1500 tak bhi jaa sakta hai; jiskee sameeksha 3 ke Wave V mein 1100 se upar band hone ke baad ki jaa sakti hai. Pichhle FY ki tulana mein behatar margin ke saath haal ke Q2 ke nateeje achchhe hain.
Yah koi trade lene ya nivesh karne ki salah nahin hai. Kripya apna vishleshan svayan karen. Aur mujhe galat hone ka adhikaar hai.


All time high breakout Sharda cropchem has given breakout of it's all time high with good volume and has sustained it successfully. Short term and mid term momentum is also good in the stock indicating strength in the trend.

Shardha Cropchem aiming for a ATH Breakout!✅Aiming for a fresh breakout from previous ATH
levels.
✅No resistance to the left if broke out.
✅Trading above key DMAs
✅Good Volume and wide candles on DTF.
❗️Little bit stretched. Ideal entry was 635 and 708.
❗️Negative Sentiments in market.
Watch 770 levels for a fresh entry. And do not bet big in these market conditions. Have your risk management rules in place.
The chart is shared only for educational purposes. Please consult your financial advisor before investing.
➡️Market Cap₹ 6,855 Cr.
➡️Current Price₹ 760
➡️Stock P/E31.5
➡️ROCE4.27 %
➡️ROE1.42 %

SHARDACROP - Daily
Upmove of >70%
Followed by consolidation of >2 months
Tightness in the price near the breakout zone
BO with huge volumes and >10% upmove on the same day

Setting up nicely Setting up nicely
SHARDACROP ( Weekly Chart)
+ Big base with good volume build up
+ Trading above Key EMAs on Daily TF
+ Consolidating at the resistance with low volume

Looking perfect for new high SHARDACROP looking good for upside momentum and it remains to hold up trend levels over there that sign to be ready for a good breakout in the upcoming days if it does not break the 540 level then the coming up moves 650,700 & 800 levels respectively.

SHARDACROP - Price Action that you should not missSHARDACROP has formed beautiful price action consisting of
Falling Wedge Pattern
Long Term Resistance
Trend Line acting as Support & Resistance
It is giving breakout of long term resistance at 575-580 and can be carried as swing trade if closes abv 580.
SL is around 535 zone (daily close)
Targets are 600 & 650
Thanks
Piyush Gupta
Learn & Earn


SHARDACROP Looking Very Strong Trading Near Breakout Zone -Trading near breakout zone with very high volume & strong momentum
-overall stock market is also took support & trying to reverse from lower zone
-if sustains above green zone then it try to hit upper resistance zone which is 19% away from here
-risk reward is looking good keep on radar

Potential up-move | Bottom fishing - SHARDACORPHello everyone! This is a new try from my side. These analysis is based on bottom fishing method. Meaning that the stock shows an uprising potential from the bottom. Fundamentally it can be due to any major decisions in the management or tremendous performance shown or any such positive actions. Technically, it would have shown an upmove using MA or RSI breakout or any such analysis.
The secret sauce is not revealed here that how I pick my stocks, however the idea is shared as an educational material. This will also help me to keep a track of my accuracy in doing analysis. Hence & also, I request anyone not to take any positions based on the accuracy of my previous feeds or moving forward.
Do your own research and analysis before investing your hard earned money. Happy trading 4ever folks!
