Sharda Cropchem Ltd. Taking support or Break itSharda Cropchem Ltd.
SECTOR: Pesticides & Agrochemicals.
52 WEEK LOW
₹ 370.50
in case the price didn't sustain at support it will give good moment at down side.
disclaimer: this is just for educational purposes only. please research by yourself or take your financial advisor advice before entering the trade.
SHARDACROP trade ideas

Sharda cropchem buy Sharda cropchem buy around 395 to 405 or cmp add more at 330-40 if comes swing target.555-60 .long term 730-40.
This is my personal view. And level .
Do your own research and analysis before investing.

Agrochemical stock pick before budgetSharda cropchem has been consolidating near strong demand zone of 400-420.
Stock has bounced from trendline which indicates confluence of support bounce
Stock can reverse before budget as chemical stocks have shown strength.
Low risk high reward trade. Stock has good fundamentals as well to hold for longer time horizon.
If you like my analysis, please like it and follow me for more such trading ideas.

Sharada Cropchem Analasis on 16 Dec 2023Sharada Cropchem Analasis on 16 Dec 2023
Company with promoter holding and FII holding
Good Reserve (1988 Cr) almost zero loans (20 Cr)
Keep strict stoploss of Rs 400 (on closing basis)
target 480
580 (52 Week high)
780
book profit as per your capacity

shardacrop stock make strong resistance at 434 435 making good price action with higher low if break resistance after 9:20 it will give good upmove
pls support and like

swing trading idea, demand supply trading
demand supply trading
demand supply trading
demand supply trading
demand supply trading
demand supply trading
demand supply trading
demand supply trading
demand supply trading

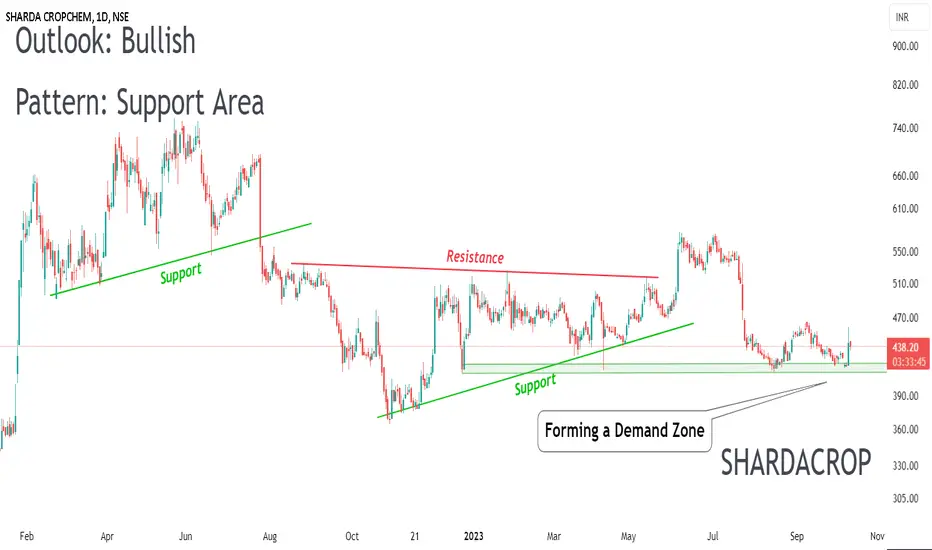
📈 Exciting Bullish Pattern Alert! 🐂📈 Exciting Bullish Pattern Alert! 🐂
📊 Pattern: Support Area
📌 Symbol/Asset: SHARDACROP
🔍 Description: Stock is around Demand zone. We might see upside if demand zone is sustained
👉 Disclosure: We are not SEBI registered analysts, this is not a buy or sell recommendation. Technical patterns are just one piece of the puzzle. Consider conducting further research, consulting with a financial advisor, and managing your risks appropriately.
20% upside potential in Sharda CropChemThe stock has seen a decline of over 45% from its all-time high (ATH) and is currently trading below its 200-day moving average (MA).
It is maintaining a consistent trading pattern within a range of 418 to 505, which constitutes a 20% range. The stock has found support at multiple points within this range and has experienced three movements from 418 to 505 within the past year.
W pattern is also being formed. Long term target can be 700 & Short term 500.
From a fundamental perspective, the company has achieved its highest-ever revenue and profit figures, with the exception of the last quarter where a significant reduction in the prices of raw materials and finished goods led to a stock revaluation as per the Accounting Policy. This revaluation impacted the gross profit (GP) and overall profitability by Rs. 71 crores. According to the management presentation, the company anticipates an improving trend in Q2FY24.

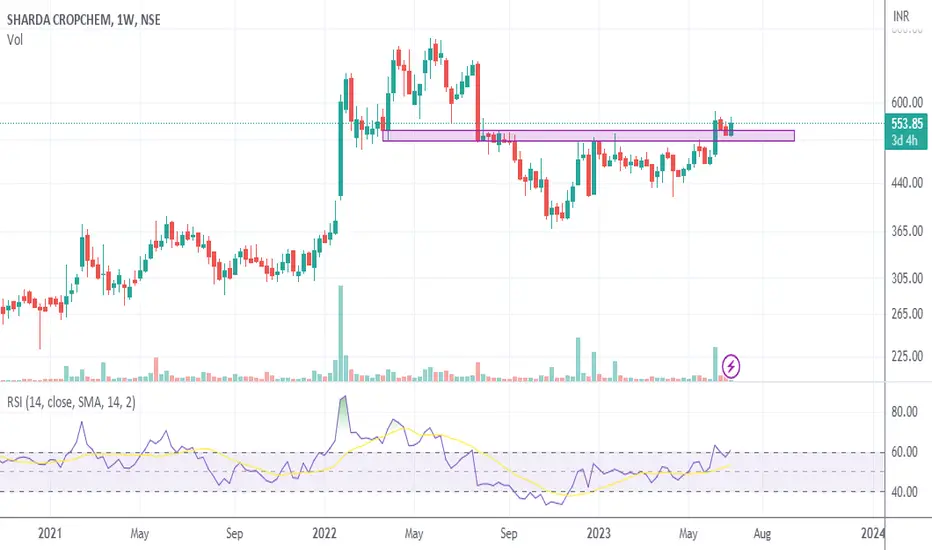
SHARDACROP Trendline and RSI SupportIn this analysis, we'll delve into the technical aspects of the weekly chart for SHARDACROP, evaluating key patterns and indicators to offer insights into potential trading opportunities.
Trend Analysis:
The chart presents a notable breakout of a weekly rising trendline. This signifies a pivotal shift in trend dynamics. Breakouts from such trendlines often indicate a transition from a bearish trend to a potentially bullish one. This breakout emphasizes the importance of observing trendlines as they can provide significant trading signals.
RSI Support:
An important aspect to consider is the support observed on the Relative Strength Index (RSI). RSI is a widely used momentum indicator that helps traders gauge the strength of a trend. The fact that the stock has found support on the RSI suggests underlying strength in the recent price movement. This support enhances the reliability of the breakout signal from the rising trendline.
Trade Strategy:
Considering the insights from the chart analysis, here's a proposed trade strategy:
Entry: Initiating a long position at the current market price (CMP) of ₹445. This entry point aligns with the breakout from the rising trendline, indicating a potential uptrend continuation.
Stop Loss (SL): Implementing a stop loss at ₹408. This level is strategically chosen to allow for minor price fluctuations while offering protection against unexpected adverse price movements. Effective risk management is crucial in trading.
Target: Setting a target price of ₹490. This target level corresponds with the potential upside suggested by the breakout from the rising trendline. It's crucial to have a clear target in mind to capitalize on potential gains.
Conclusion:
In conclusion, the breakout from the weekly rising trendline and the observed support at RSI point towards the likelihood of further upward movement in SHARDACROP. It's important to remember that while technical analysis offers valuable insights, no analysis guarantees specific outcomes in the stock market. Every trade involves risks, and prudent risk management is essential.
Before making any trading decisions, it's recommended to consult with financial professionals and to consider your risk tolerance, trading strategy, and market conditions.


Sharda Cropchem: Attempting to break high of breakout candleRecently Sharda Cropchem gave breakout and retraced thereafter for two weeks. Now stock is again showing strength. Keep on radar for closing above 580.

Sharda Cropchem: Breakout retestSharda Cropchem is sustaining above breakout level and forming positive candle in current week after two consecutive red candle from last week. Keep on radar. Seems stock will continue upward journey.

Sharda Cropchem: Breakout retestingSeems Sharda Cropchem has retested its breakout area and showing buying interest at retest zone. Keep on radar.
SHARDA CROPCHEM IS READY?
DISCLAIMER:My post, video, presentation and writing are only for education purposes and are not intended as investment advice. I cannot guarantee the accuracy of any information provided.
I AM NOT SEBI REGISTER FINANCIAL ADVISOR

#SHARDACROPTurned positional with 6 * 30 = 180 mins which changed it's sentiment
CCI S to B with Hyper momentum 194 in 30m


BUY TODAY SELL TOMORROW for 5% DON’T HAVE TIME TO MANAGE YOUR TRADES?
- Take BTST trades at 3:25 pm every day
- Try to exit by taking 4-7% profit of each trade
- SL can also be maintained as closing below the low of the breakout candle
Now, why do I prefer BTST over swing trades? The primary reason is that I have observed that 90% of the stocks give most of the movement in just 1-2 days and the rest of the time they either consolidate or fall
Resistance Breakout in SHARDACROP
BUY TODAY SELL TOMORROW for 5%

SHARDACROP - Range Breakout - 35% upside potentialSHARDACROP has been in sideways correction since May'22 for 1 year now.
It has given range breakout with good volumes.
Momentum looks strong, we can expect it to reach it's previous high of 750+ levels soon in 2-4 months timeframe.
SL: Daily candle close below 515.

Sharda Cropchem Analysis Stock is trading near to weekly and daily BO zone, massive volume spike seen on both TF chart, follow chart for proper support and resistance levels.

Sharda Cropchem on fireChart -> Sharda Cropchem Daily
Sharda Cropchem VCP breakout with volume.
CMP: 555
Good Range: 510 to 550
Target: 590, 650, 690
SL: 500 Daily Close


Flag (Bullish)SHARDACROP
The price is currently showing signs of resuming a strong rally after a temporary pause.
This resumption is characterized by a pattern known as a bullish Flag. The Flag pattern typically occurs within a dynamic market rally and represents a brief consolidation or pause as the market takes a moment to gather momentum before continuing its upward movement. The pattern is formed by two parallel trend lines, which may slope downward against the prevailing uptrend.
The confirmation of the bullish Flag pattern comes when the price breaks above the upper boundary of the pattern, signaling a resumption of the upward rally. This breakout suggests that the temporary pause is over, and the price is likely to continue its upward surge.
Note for everyone who came across this reference:
This chart analysis is only for reference purpose.
This is not buying or selling recommendations.
I am not SEBI registered.
Please consult your financial advisor before taking any trade.

A good breakout above long term resistanceTarget 647 and 700.. SL 499.. Breaking out long term resistance with volume
