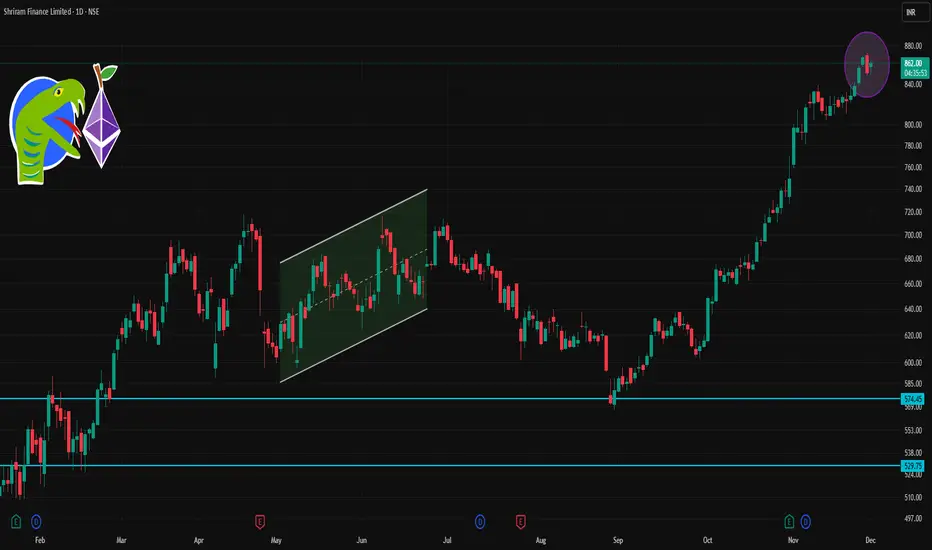
Shriram Fin (D): Cautiously Bullish - Breakout with IndecisionTimeframe: Daily | Scale: Linear
The stock has attempted a breakout from a multi-week consolidation range, hitting a new All-Time High. However, the formation of a Neutral Candle on high volume signals a fierce battle between buyers and sellers at the top. The breakout needs confirmation.
📈 1.
Next report date
—
Report period
—
EPS estimate
—
Revenue estimate
—
52.45 INR
95.54 B INR
411.24 B INR
1.40 B
About Shriram Finance Limited
Sector
Industry
CEO
Parag Sharma
Website
Headquarters
Mumbai
Founded
1979
Identifiers
2
ISININE721A01047
Shriram Finance Ltd. engages in the provision of financial services. It offers commercial vehicle finance, consumer finance, life and general insurance, stock broking, chit funds, and distribution of financial products such as life and general insurance products, and units of mutual funds. The company was founded on June 30, 1979 and is headquartered in Mumbai, India.
Related stocks

Shriram Finance Intraday Price Action AnalysisThis projection is valid till 24th Dec 2025 only.
Shriram Finance opened gap up today 22-Dec and remained bullish throughout the day. However 944 to 937 seems to be a hurdle for the bulls as they were not able to sustain 940 levels and the stocks closed at 934 levels with higher volms.
It could mean

SHRIRAMFINSHRIRAMFIN
bullish trend is Showing on the chart.
buy signals in
technical indicators and
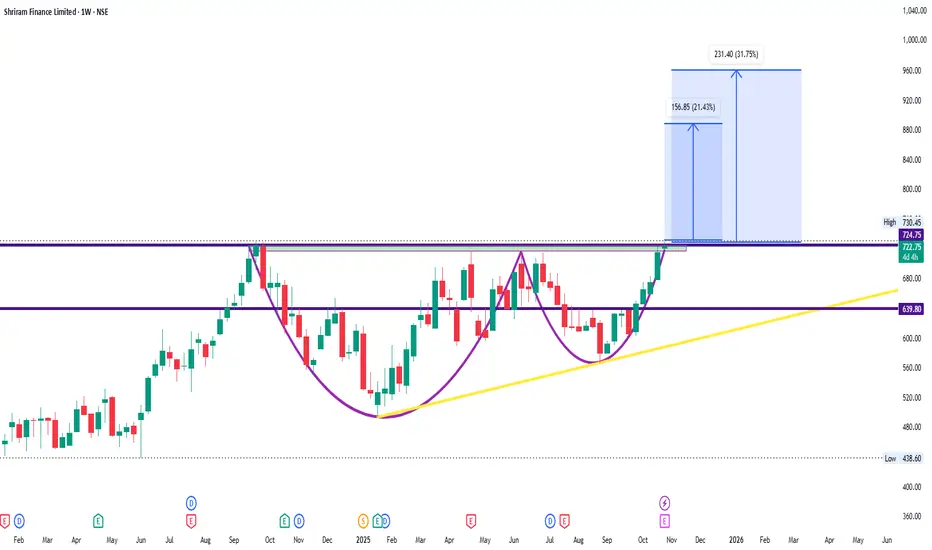
cup with handle chart pattern.
Watch for a breakout above 720/725 to sustain the bullish trend. If the resistance holds, there could be a retest towards 640/650 and an uptrend from here.
Shriramfin - Good possibility stock has topped for now.
There is a good possibility that Shriramfin has completed / completing Wave 5 as a 5th wave extension.
W1 = W3 (equality)
W5 = 1.618 x of W1-3
Internal wave counts match.
Book profits / Exit.

#LONG on SHRIRAM FINANCE for LONG TERM; 25 Year High + BreakoutThe scrip was trading below multi-year resistance trend line since 2008.It gave a breakout from the trend line on 24th Jan'24. It formed a large bullish candle on a monthly time frame returning 16% in JAN'23 and nearly 99.5% in last 12 months.
The Stock rose nearly 3.30% today hitting an ATH of 244

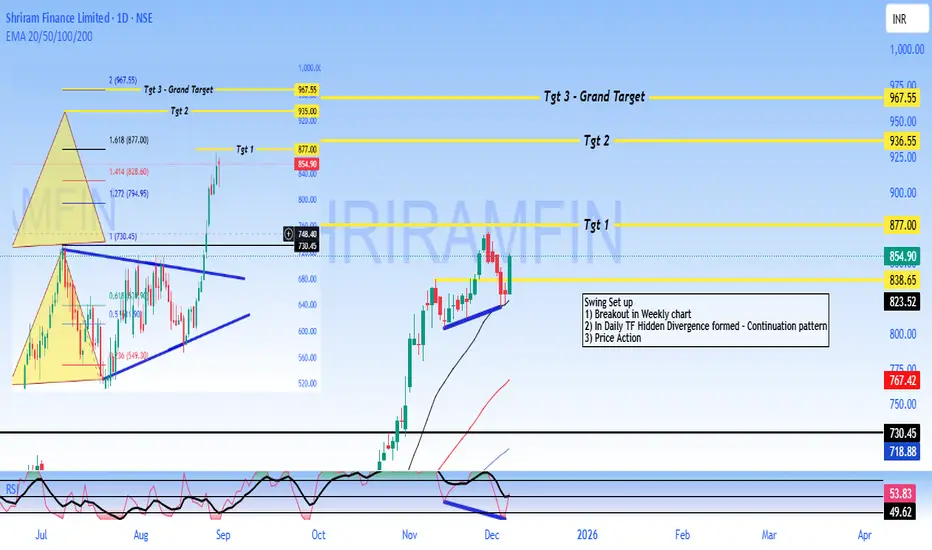
SHRIRAM - Buy - SwingTrading #Shriram Finance Limited - #Technical Analysis
Price: 854.90
#Technical Setup
Pattern: Continuation pattern with bullish hidden divergence following weekly breakout
Key Levels:
- Target 1: 877.00
- Target 2: 936.55
- Target 3: 967.55
- Support: 838 - 825 (critical)
- Major Support: 730.45
#O
Shriram Finance – Rounded Bottom Breakout Approaching REV. AREAThis daily chart of Shriram Finance shows a rounded bottom base breaking out above a long consolidation band, with the ENTRY zone placed just over the old resistance and the SL anchored below the higher‑low support. Price has rallied strongly toward the marked Trail Target and is now pulling back fr

SHRIRAMFIN 1 Day Time Frame 📊 Current Snapshot
Latest live price: ~ ₹852–857 (depending on trade moment).
Today’s high / low range: ~ ₹861.95 high / ~ ₹850.40 low.
52-week range: ₹493.35 (low) ↔ ₹872.00 (high).
✅ What This Means for Intraday / Next Sessions
If price stays above ~₹857–858 (pivot) — bias remains bullish → c
Rally may be over nowResults are not so good so can see a correction in this stock till the trendline. I would have booked profits looking at the current sell off. This could be a shake off post breakout but doesn't seem so.

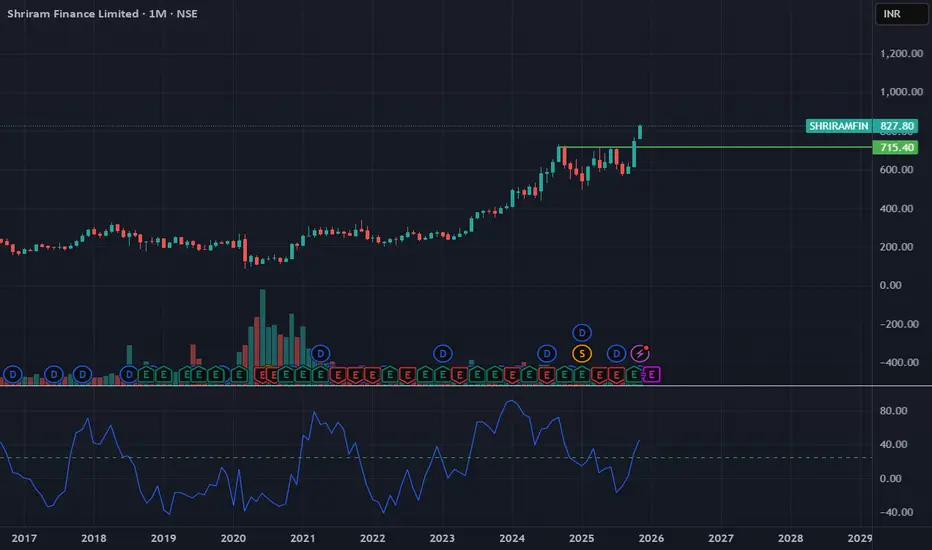
SHRIRAMFIN - Monthly Chart Analysis: All-Time High Breakout🚀 SHRIRAMFIN - Monthly Chart Analysis: All-Time High Breakout in NBFC Giant! 💰
Symbol: SHRIRAMFIN | Exchange: NSE | Timeframe: 1 Month | Theme: Multi-Year Breakout & Trend Continuation
The monthly chart for Shriram Finance Ltd. (SHRIRAMFIN) presents a phenomenal technical picture, confirming a pow
See all ideas
Summarizing what the indicators are suggesting.
Neutral
SellBuy
Strong sellStrong buy
Strong sellSellNeutralBuyStrong buy
Neutral
SellBuy
Strong sellStrong buy
Strong sellSellNeutralBuyStrong buy
Neutral
SellBuy
Strong sellStrong buy
Strong sellSellNeutralBuyStrong buy
An aggregate view of professional's ratings.
Neutral
SellBuy
Strong sellStrong buy
Strong sellSellNeutralBuyStrong buy
Neutral
SellBuy
Strong sellStrong buy
Strong sellSellNeutralBuyStrong buy
Neutral
SellBuy
Strong sellStrong buy
Strong sellSellNeutralBuyStrong buy
Displays a symbol's price movements over previous years to identify recurring trends.
97SFL28
Shriram Finance Limited 9.7% 02-NOV-2028Yield to maturity
9.14%
Maturity date
Nov 2, 2028
872SFL32
Shriram Finance Limited 8.72% 17-AUG-2032Yield to maturity
8.61%
Maturity date
Aug 17, 2032
915SFL29A
Shriram Finance Limited 9.15% 28-JUN-2029Yield to maturity
8.34%
Maturity date
Jun 28, 2029
875SFL26
Shriram Finance Limited 8.75% 15-JUN-2026Yield to maturity
8.22%
Maturity date
Jun 15, 2026
920SFL29
Shriram Finance Limited 9.2% 22-MAY-2029Yield to maturity
7.87%
Maturity date
May 22, 2029
9SFL28A
Shriram Finance Limited 9.0% 28-MAR-2028Yield to maturity
7.57%
Maturity date
Mar 28, 2028
850SFL26
Shriram Finance Limited 8.5% 01-DEC-2026Yield to maturity
7.50%
Maturity date
Dec 1, 2026
97SFL29
Shriram Finance Limited 9.7% 06-FEB-2029Yield to maturity
7.43%
Maturity date
Feb 6, 2029
930SFL28
Shriram Finance Limited 9.3% 02-NOV-2028Yield to maturity
6.60%
Maturity date
Nov 2, 2028
957ICCL25
Shriram Finance Limited 9.3% 06-FEB-2029Yield to maturity
6.50%
Maturity date
Feb 6, 2029
89267SFL27
Shriram Finance Limited 8.9267% 20-JUL-2027Yield to maturity
6.45%
Maturity date
Jul 20, 2027
See all SHRIRAMFIN bonds
Frequently Asked Questions
The current price of SHRIRAMFIN is 957.80 INR — it has increased by 2.45% in the past 24 hours. Watch Shriram Finance Limited stock price performance more closely on the chart.
Depending on the exchange, the stock ticker may vary. For instance, on NSE exchange Shriram Finance Limited stocks are traded under the ticker SHRIRAMFIN.
SHRIRAMFIN stock has risen by 11.98% compared to the previous week, the month change is a 16.10% rise, over the last year Shriram Finance Limited has showed a 64.80% increase.
We've gathered analysts' opinions on Shriram Finance Limited future price: according to them, SHRIRAMFIN price has a max estimate of 1,225.00 INR and a min estimate of 795.00 INR. Watch SHRIRAMFIN chart and read a more detailed Shriram Finance Limited stock forecast: see what analysts think of Shriram Finance Limited and suggest that you do with its stocks.
SHRIRAMFIN reached its all-time high on Dec 19, 2025 with the price of 913.50 INR, and its all-time low was 0.40 INR and was reached on Feb 10, 1999. View more price dynamics on SHRIRAMFIN chart.
See other stocks reaching their highest and lowest prices.
See other stocks reaching their highest and lowest prices.
SHRIRAMFIN stock is 3.03% volatile and has beta coefficient of 1.46. Track Shriram Finance Limited stock price on the chart and check out the list of the most volatile stocks — is Shriram Finance Limited there?
Today Shriram Finance Limited has the market capitalization of 1.76 T, it has increased by 2.48% over the last week.
Yes, you can track Shriram Finance Limited financials in yearly and quarterly reports right on TradingView.
Shriram Finance Limited is going to release the next earnings report on Jan 22, 2026. Keep track of upcoming events with our Earnings Calendar.
SHRIRAMFIN earnings for the last quarter are 12.27 INR per share, whereas the estimation was 11.15 INR resulting in a 10.01% surprise. The estimated earnings for the next quarter are 12.28 INR per share. See more details about Shriram Finance Limited earnings.
Shriram Finance Limited revenue for the last quarter amounts to 63.83 B INR, despite the estimated figure of 63.43 B INR. In the next quarter, revenue is expected to reach 69.32 B INR.
SHRIRAMFIN net income for the last quarter is 23.14 B INR, while the quarter before that showed 21.59 B INR of net income which accounts for 7.17% change. Track more Shriram Finance Limited financial stats to get the full picture.
Shriram Finance Limited dividend yield was 1.51% in 2024, and payout ratio reached 19.48%. The year before the numbers were 1.91% and 22.92% correspondingly. See high-dividend stocks and find more opportunities for your portfolio.
As of Dec 24, 2025, the company has 79.87 K employees. See our rating of the largest employees — is Shriram Finance Limited on this list?
EBITDA measures a company's operating performance, its growth signifies an improvement in the efficiency of a company. Shriram Finance Limited EBITDA is 192.93 B INR, and current EBITDA margin is 75.23%. See more stats in Shriram Finance Limited financial statements.
Like other stocks, SHRIRAMFIN shares are traded on stock exchanges, e.g. Nasdaq, Nyse, Euronext, and the easiest way to buy them is through an online stock broker. To do this, you need to open an account and follow a broker's procedures, then start trading. You can trade Shriram Finance Limited stock right from TradingView charts — choose your broker and connect to your account.
Investing in stocks requires a comprehensive research: you should carefully study all the available data, e.g. company's financials, related news, and its technical analysis. So Shriram Finance Limited technincal analysis shows the strong buy rating today, and its 1 week rating is strong buy. Since market conditions are prone to changes, it's worth looking a bit further into the future — according to the 1 month rating Shriram Finance Limited stock shows the strong buy signal. See more of Shriram Finance Limited technicals for a more comprehensive analysis.
If you're still not sure, try looking for inspiration in our curated watchlists.
If you're still not sure, try looking for inspiration in our curated watchlists.