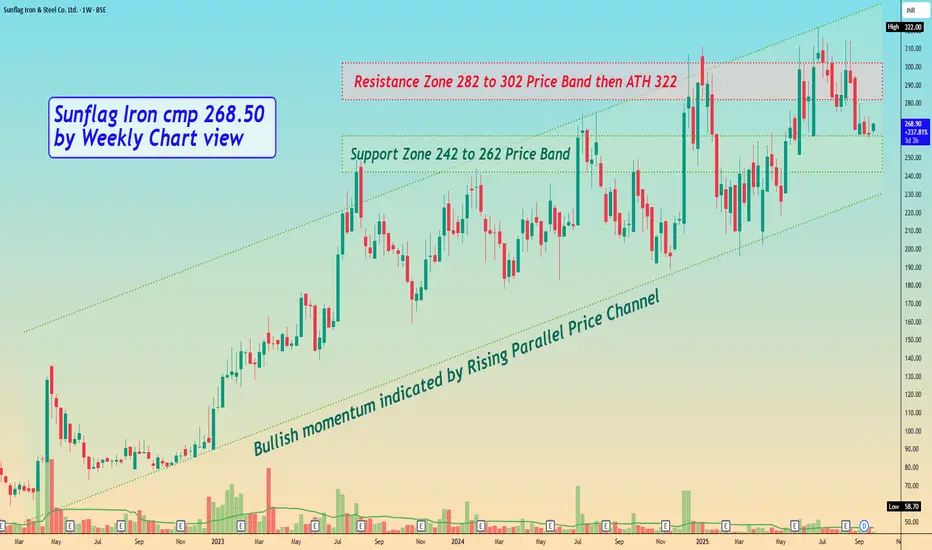
Sunflag Iron cmp 268.50 by Weekly Chart viewSunflag Iron cmp 268.50 by Weekly Chart view
- Support Zone 242 to 262 Price Band
- Resistance Zone 282 to 302 Price Band then ATH 322
- Bullish momentum indicated by Rising Parallel Price Channel
- Volumes are seen getting in close sync with average traded quantity
11.18 INR
1.62 B INR
35.34 B INR
39.55 M
About Sunflag Iron & Steel Co. Ltd.
Sector
Industry
CEO
Dev Dyuti Sen
Website
Headquarters
Nagpur
ISIN
INE947A01014
FIGI
BBG000D0KQ77
Sunflag Iron & Steel Co. Ltd. is a holding company, which engages in the manufacture and trade of iron and steel products. Its products include forging quality steel, forging quality ingots, spring steel, free and semi free cutting steel, micro alloyed steel, bearing steel, cold forging quality steel, engine valve steel, stainless steel rebar, stainless steel, super alloys, and tool steels. The company was founded by Satyadev Bhardwaj on September 12, 1984 and is headquartered in Nagpur, India.
Related stocks
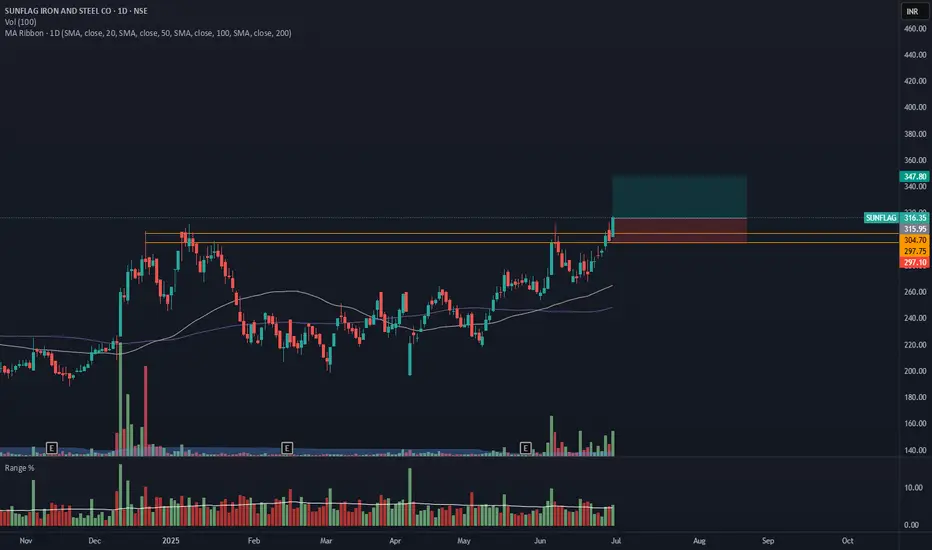
SUNFLAG- Breakout from DTFSUNFLAG has resistance weakening on the Daily charts and has given a breakout with good volume.
The target of this pattern signals an upside potential of 10% from the current price level in the medium term.
The stock is trading above its 50- and 100-day simple moving averages (SMAs). The range is
Sunflag Iron And Steel Company Limited Good chartThis chart created inverse head and shoulders pattern
Breakout level cross 306 with volume buildup.
Good entry above 306 , target 408 (34%) of pattern depth

Sunflag IronStock: Sunflag Iron
Ex: NSE
Structure: Long term uptrend
Medium term: lower high lower low into aggressive buying leaving OB
Strong term: with a small buying pressure in Nifty, stock is looking poised to make an upmove.
Seeing impulse buying at the order block validating the OB.
Taking an entry o

Sunflag Breaking Out Trendline NSE:SUNFLAG broke out today, Closed above Major Levels, and Crossed the Trendline with heavy volumes, with MACD showing a buy signal.
📌Thank you for exploring my idea! I hope you found it valuable.
🙏FLLOW for more
👍BOOST if useful
✍️COMMENT Below your views.
Meanwhile, check out my other stock

BUY TODAY SELL TOMORROW for 5%DON’T HAVE TIME TO MANAGE YOUR TRADES?
- Take BTST trades at 3:25 pm every day
- Try to exit by taking 4-7% profit of each trade
- SL can also be maintained as closing below the low of the breakout candle
Now, why do I prefer BTST over swing trades? The primary reason is that I have observed that

sunflag Tgt-275Sunflag stock strong breakout has given today so, shortly will reach 275 target level

Sunflag Iron & Steel Co. Ltd! broke the ATH and retesting it!Sunflag Iron & Steel Co. Ltd. is a holding company, which engages in the manufacture and trade of iron and steel products.
Sunflag Iron & Steel Co. Ltd! broke the ATH and retesting it! chance for 20- 25% move.
Market Cap- 45B INR
For educational purposes only!

1:5 SWING TRADING OPPORTUNITY IN SUNFLAGRefer the chart for Entry,Target and SL.
NOTE: This trade is only for Equity Swing buy and not to be considered for options trading.
Please do follow Position Sizing and Risk Reward Ratio while planning any trades.
Note: This information is for education purpose only and please do your own resea


See all ideas
Summarizing what the indicators are suggesting.
Oscillators
Neutral
SellBuy
Strong sellStrong buy
Strong sellSellNeutralBuyStrong buy
Oscillators
Neutral
SellBuy
Strong sellStrong buy
Strong sellSellNeutralBuyStrong buy
Summary
Neutral
SellBuy
Strong sellStrong buy
Strong sellSellNeutralBuyStrong buy
Summary
Neutral
SellBuy
Strong sellStrong buy
Strong sellSellNeutralBuyStrong buy
Summary
Neutral
SellBuy
Strong sellStrong buy
Strong sellSellNeutralBuyStrong buy
Moving Averages
Neutral
SellBuy
Strong sellStrong buy
Strong sellSellNeutralBuyStrong buy
Moving Averages
Neutral
SellBuy
Strong sellStrong buy
Strong sellSellNeutralBuyStrong buy
Displays a symbol's price movements over previous years to identify recurring trends.
Frequently Asked Questions
The current price of SUNFLAG is 248.05 INR — it has decreased by −1.67% in the past 24 hours. Watch Sunflag Iron & Steel Co. Ltd. stock price performance more closely on the chart.
Depending on the exchange, the stock ticker may vary. For instance, on NSE exchange Sunflag Iron & Steel Co. Ltd. stocks are traded under the ticker SUNFLAG.
SUNFLAG stock has fallen by −9.38% compared to the previous week, the month change is a −4.86% fall, over the last year Sunflag Iron & Steel Co. Ltd. has showed a 25.33% increase.
SUNFLAG reached its all-time high on Jul 3, 2025 with the price of 322.00 INR, and its all-time low was 7.00 INR and was reached on Oct 31, 2008. View more price dynamics on SUNFLAG chart.
See other stocks reaching their highest and lowest prices.
See other stocks reaching their highest and lowest prices.
SUNFLAG stock is 4.19% volatile and has beta coefficient of 1.35. Track Sunflag Iron & Steel Co. Ltd. stock price on the chart and check out the list of the most volatile stocks — is Sunflag Iron & Steel Co. Ltd. there?
Today Sunflag Iron & Steel Co. Ltd. has the market capitalization of 44.81 B, it has increased by 2.69% over the last week.
Yes, you can track Sunflag Iron & Steel Co. Ltd. financials in yearly and quarterly reports right on TradingView.
SUNFLAG net income for the last quarter is 455.30 M INR, while the quarter before that showed 626.10 M INR of net income which accounts for −27.28% change. Track more Sunflag Iron & Steel Co. Ltd. financial stats to get the full picture.
Yes, SUNFLAG dividends are paid annually. The last dividend per share was 0.75 INR. As of today, Dividend Yield (TTM)% is 0.30%. Tracking Sunflag Iron & Steel Co. Ltd. dividends might help you take more informed decisions.
Sunflag Iron & Steel Co. Ltd. dividend yield was 0.32% in 2024, and payout ratio reached 8.34%. The year before the numbers were 0.00% and 0.00% correspondingly. See high-dividend stocks and find more opportunities for your portfolio.
As of Nov 21, 2025, the company has 3.8 K employees. See our rating of the largest employees — is Sunflag Iron & Steel Co. Ltd. on this list?
EBITDA measures a company's operating performance, its growth signifies an improvement in the efficiency of a company. Sunflag Iron & Steel Co. Ltd. EBITDA is 4.21 B INR, and current EBITDA margin is 11.27%. See more stats in Sunflag Iron & Steel Co. Ltd. financial statements.
Like other stocks, SUNFLAG shares are traded on stock exchanges, e.g. Nasdaq, Nyse, Euronext, and the easiest way to buy them is through an online stock broker. To do this, you need to open an account and follow a broker's procedures, then start trading. You can trade Sunflag Iron & Steel Co. Ltd. stock right from TradingView charts — choose your broker and connect to your account.
Investing in stocks requires a comprehensive research: you should carefully study all the available data, e.g. company's financials, related news, and its technical analysis. So Sunflag Iron & Steel Co. Ltd. technincal analysis shows the sell today, and its 1 week rating is sell. Since market conditions are prone to changes, it's worth looking a bit further into the future — according to the 1 month rating Sunflag Iron & Steel Co. Ltd. stock shows the buy signal. See more of Sunflag Iron & Steel Co. Ltd. technicals for a more comprehensive analysis.
If you're still not sure, try looking for inspiration in our curated watchlists.
If you're still not sure, try looking for inspiration in our curated watchlists.